Experiment
Last compiled on 23-03-2026
1 Getting started
To copy the code, click the button in the upper right corner of the code-chunks.
1.1 clean up
rm(list = ls())
gc()
1.2 custom functions
We defined a number custom functions, at Download custom_functions.R.
source("./custom_functions.R")1.3 necessary packages
tidyverse: data wranglingigraph: generate and visualize graphsparallel: parallel computing to speed up simulationforeach: looping in paralleldoParallel: parallel backend forforeachggplot2: data visualizationggh4x: hacks forggplot2ggpubr: make visualizations publication-ready
packages = c("tidyverse", "igraph", "ggplot2", "parallel", "doParallel", "foreach", "ggh4x", "ggpubr",
    "plotly", "RColorBrewer", "grid", "gridExtra", "patchwork", "ggplotify", "ggraph", "gganimate", "RColorBrewer",
    "ggtext", "magick", "jsonlite", "lubridate", "ggtext")

invisible(fpackage.check(packages))
rm(packages)
2 import data
data <- read.csv("./rawdata/all_apps_wide_2026-02-23.csv")
times <- read.csv("./rawdata/PageTimes-2026-02-23.csv")

table(data$survey.1.player.clarity)
#>
#> 2 3 4 5
#> 1 2 13 19table(data$survey.1.player.enjoyment)#>
#> 1 2 3 4 5
#> 1 4 9 11 10table(data$survey.1.player.strategy)#>
#>
#> 970
#> At first I tried to predict what other participants would choose but after that I found out that each of them has a different color, so at some point I selected things just randomly but at a certain time they were stuck and chose only their main color
#> 1
#> From the first round, I've noticed that people tend to pick red, because of the maximum points it gives out, therefore after the first round I only picked the red shirt.
#> 1
#> High risk high reward, I wanted to get more so I picked blue
#> 1
#> I choose the strategy of fixed reward in order to minimize the unmatche with neighbours.
#> 1
#> I always like to wear different colors from others And red is my favorite color
#> 1
#> I chose my color based on coordination with my neighbors to maximize points. I observed what my neighbors did in previous rounds and picked the color that would match at least one of them. When neighbors were split, I picked Blue, because it gave slightly higher points than Red in that situation. Once neighbors coordinated fully on one color, I matched that color to get the maximum coordination reward. My reasoning was to balance personal preference with coordination, since coordination gave more points.
#> 1
#> I chose red because i new most of the other participants would choose it.
#> 1
#> i chose the red color
#> 1
#> I chose the Red shirt because it offered a higher fixed reward (15 points) and a higher maximum payout (55 points) when coordinated with both neighbors. My strategy was to stay consistent with Red to encourage my neighbors to coordinate for the maximum mutual benefit
#> 1
#> I mostly chose red because of the points
#> 1
#> I noticed that my neighbor was always choosing red
#> 1
#> I picked the red shirt because of the fixed reward
#> 1
#> I saw most people preferred to use red color shirt so I sticked with that
#> 1
#> I settled for a shirt with guaranteed point which was the red shirt.
#> 1
#> I started out using red, but seeing that most people ended up choosing blue, i swapped to blue
#> 1
#> I stick to red because it gave the highest total points by considering both fixed reward and coordination reward.
#> 1
#> i sticked to my color red
#> 1
#> I tried to figure out a pattern at first, whether people would change their minds on different days or not, and also tested the effect my outfit changes had on others. But after the first few rounds, my neighbors became robotic or fell into a rut, wearing two red and two blue T-shirts every day without any changes. So I tried joining the blue (opposing) team, thinking they might not like it and change to red. I was wrong.
#> 1
#> I tryed to match with my neighbours,they did the same thing and just kept going like that
#> 1
#> I was choosing red it was more popular
#> 1
#> i was choosing what was best for me and it is my favorite color
#> 1
#> Looked at neighbours colours from the previous games on which one is likely to be chosen.
#> 1
#> Majority always wins in the long term
#> 1
#> Paying attention
#> 1
#> Pick red
#> 1
#> Red everytime. No strategy
#> 1
#> the one that i was assigned at the beginning
#> 1
#> The one with more numbers
#> 1
#> the option that gave me and the other 2 the most and they were always picking red so it was pointless me going blue.
#> 1
#> tried to matched my color with at least one of them while prioritized red
#> 1table(data$survey.1.player.comments)#>
#>
#> 982
#> I enjoyed the experiment. Should be compensated also for the time waiting for others to join
#> 1
#> It's a very slow experiment, including a game to play while waiting is nice, but the game is rather difficult and not enjoyable at all
#> 1
#> It was very fun thank you!
#> 1
#> no
#> 1
#> No
#> 1
#> No feedback
#> 2
#> no, all good
#> 1
#> none
#> 3
#> None
#> 1
#> nothing else
#> 1
#> Really cool study. I like the idea that there are additional points involved that give out bonus payouts. I've really enjoyed it. Thank you very much.
#> 1
#> Thank you for the survey, I enjoyed.
#> 1
#> The game was clear and engaging. The payoff tables helped understand the trade-off between personal preference and coordination. It was interesting to see how patterns emerged over rounds.
#> 1
#> The study went on a little long. Especially after waiting 20 minutes to be matched with people
#> 1
#> The time to respond seemed too long, and some people deliberately waited until the very end, until the last second, which prolonged the game a bit.
#> 1table(data$survey.1.player.perceived_rq)#>
#>
#> 967
#> A test to see if there is a preferential bias towards your own color and to see if this has an impact on your choices although mathematically, choosing blue is better in 2/3 cases.
#> 1
#> decision making
#> 1
#> experiment of how people think and decide when other people choose the opposite side
#> 1
#> fashion
#> 1
#> Go with what gives most
#> 1
#> How greedy people can be, and if seeing the options from others would make to change their minds
#> 1
#> How people are willing to come together to achieve big things.
#> 1
#> How people follow and decide on one thing as a collective
#> 1
#> I guess it was about cooperation, your outcome comes from other people outcomes, so people that in the first rounds chose the blue t-shirt, saw that everyone else is picking the red one - then later on they started picking red themselves to maximise profit.
#> 1
#> I think it is about memory
#> 1
#> i think the experiment was about if people can work together for one common goal
#> 1
#> I think the experiment was intended to investigate the influence of others on one's own choices. Looking at other people's decisions and thinking about them, we start to question our own decisions, which sometimes causes us to even stop listening to ourselves and our priorities (just like I sometimes stopped wearing red, the color I was supposed to strive for).
#> 1
#> I think the researchers wanted to study how people make decisions in a network when their goal is to coordinate with others, even if they have personal preferences. They are likely interested in coordination, social influence, and decision-making under uncertainty.
#> 1
#> i think this experiment for peoples fashion sense and their mindset for fashion
#> 1
#> I think this experiment was based on the deciding factors people tend to have,we as human being more lenient on the majority than to our own beliefs.
#> 1
#> It was about counting the number of neighbors who wears 2 different shirts.
#> 1
#> It was about decision-making and seeing socially what people would choose
#> 1
#> it was about picking a color between two and get points
#> 1
#> Maybe to see at what point people wonder whether they can get better rewards when the truth is already known
#> 1
#> No idea
#> 1
#> Patience
#> 1
#> Patience
#> 1
#> Preference
#> 1
#> Risk more win more
#> 1
#> Seeing the impact of points when it comes to decision making. When do people end up swapping colors.
#> 1
#> Team influence on players
#> 1
#> The experiment seems to be about social coordination and decision-making in networks. It explores how fixed incentives versus group rewards influence individuals to align their choices with others to reach a collective equilibrium
#> 1
#> The experiment was about decision making .The researchers are trying to know the mentality of people when making decisions in variable rewards.
#> 1
#> The researchers are examining coordination behavior and strategic decision-making to see how individuals respond to incentives and social alignment
#> 1
#> to see if other peoples choices would influence my own
#> 1
#> to see what options i would pick
#> 1
#> Wants to see how people make choices
#> 1
#> What will someone choose if they are seeing the points on something?
#> 1table(data$survey.1.player.majority)#>
#> 1 2 3
#> 24 8 3# cbind(data$participant.node,data$participant.role)[complete.cases(
# cbind(data$participant.node,data$participant.role)),]
# bonus <- data[, c('participant.bonus', 'participant.label')][!is.na(data$participant.bonus),]
# row.names(bonus) <- c(1:nrow(bonus))
# bonus_file <- bonus %>% select(participant.label, participant.bonus)
# write.table( bonus_file, file = 'prolific_bonus.csv', sep = ',', row.names = FALSE, col.names =
# FALSE, quote = FALSE )3 results
On 23-2-2026, I recruited 80 Prolific participants, to populate a network of N=50 (with a 10% minority group).
net <- jsonlite::fromJSON("./networks/network_test_n50.json")

g <- graph_from_adjacency_matrix(net$adj_matrix, mode = "undirected")
V(g)$role <- ifelse(net$role_vector == 1, "trendsetter", "conformist")

fplot_graph(g)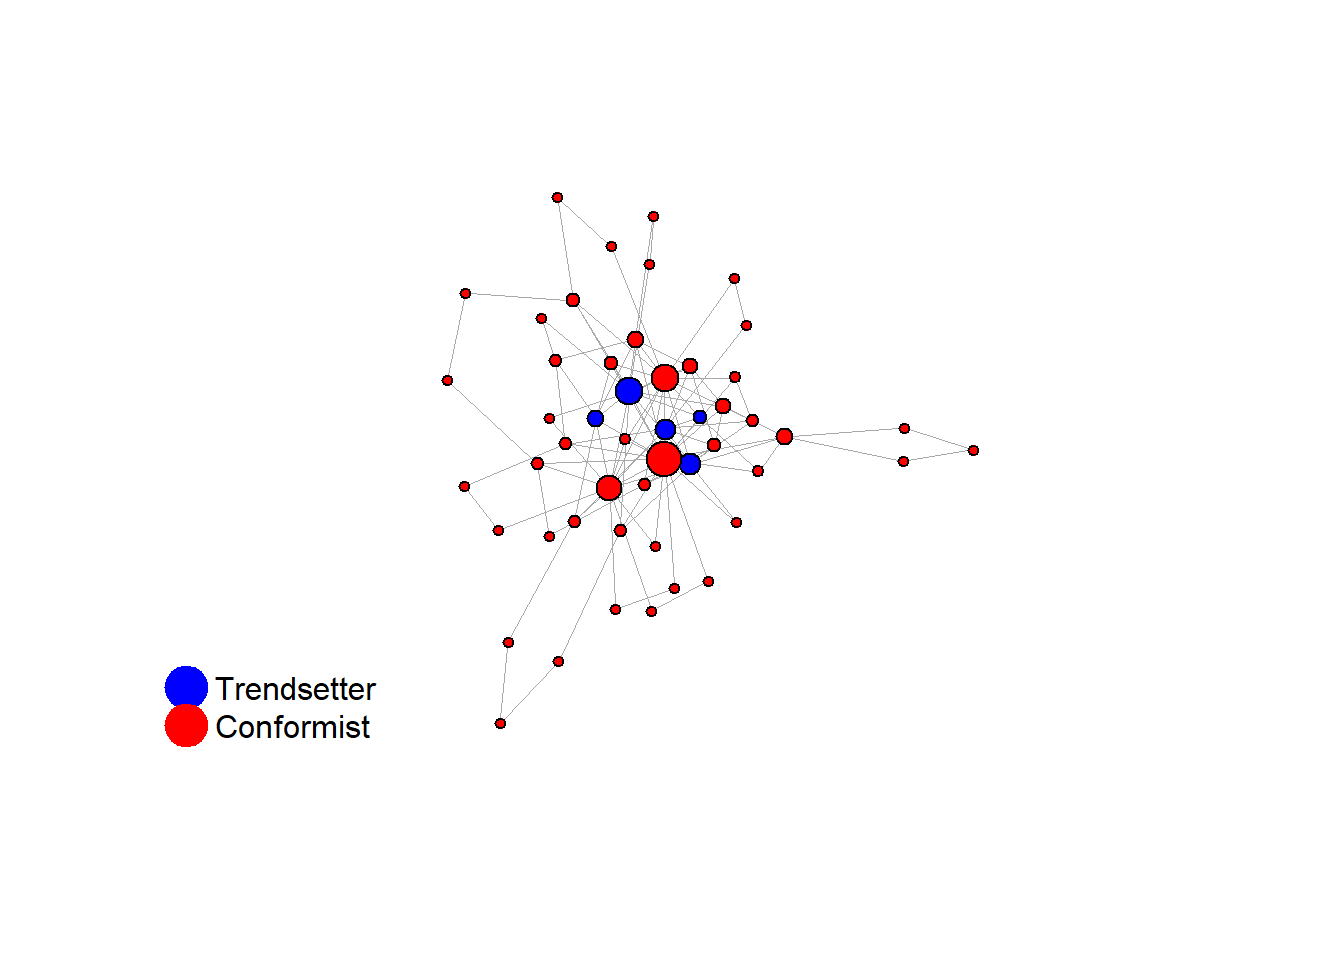
3.1 diagnostics
3.1.1 arrival from Prolific
# subset experimental session
data <- data[data$session.code == "266ra4tr", ]
times <- times[times$session_code == "266ra4tr", ]

# clean
test <- data %>%
    transmute(participant_id = participant.code, participant_label = participant.label, id_in_session = participant.id_in_session,
        consent_given = consent.1.player.consent, consent_timestamp = consent.1.player.consent_timestamp,
        role = participant.role, is_dropout = participant.is_dropout, dropout_app = participant._current_app_name,
        comprehension_retries = comprehension.1.player.comprehension_retries, passed_comprehension = !participant._current_app_name %in%
            c("consent", "comprehension"), choice = unpop.1.player.choice, failed_checks = participant.failed_checks,
        exit_early = participant.exit_early, participated = participant._current_page_name == "PaymentInfo") %>%
    filter(!is.na(consent_given)) %>%
    mutate(bot = ifelse(participant_label == "", 1, 0), bot = factor(bot, levels = c(0, 1), labels = c("Prolific participant",
        "Bot")), consent_timestamp = ymd_hms(consent_timestamp), final_state = case_when(failed_checks >
        0 ~ "Failed comprehension", exit_early == 1 ~ "Could not be grouped", participated ~ "Participated",
        TRUE ~ "Too late")) %>%
    arrange(consent_timestamp) %>%
    mutate(arrival_order = row_number())

ggplot(test, aes(x = consent_timestamp, y = arrival_order)) + geom_point(aes(color = role, shape = bot),
    size = 3, alpha = 0.5) + scale_shape_manual(values = c(16, 2)) + scale_color_manual(values = c("blue",
    "red")) + labs(x = "Arrival time", y = "Arrival order", color = "Role", shape = "Type", title = "Participant arrivals from Prolific over time") +
    theme_minimal()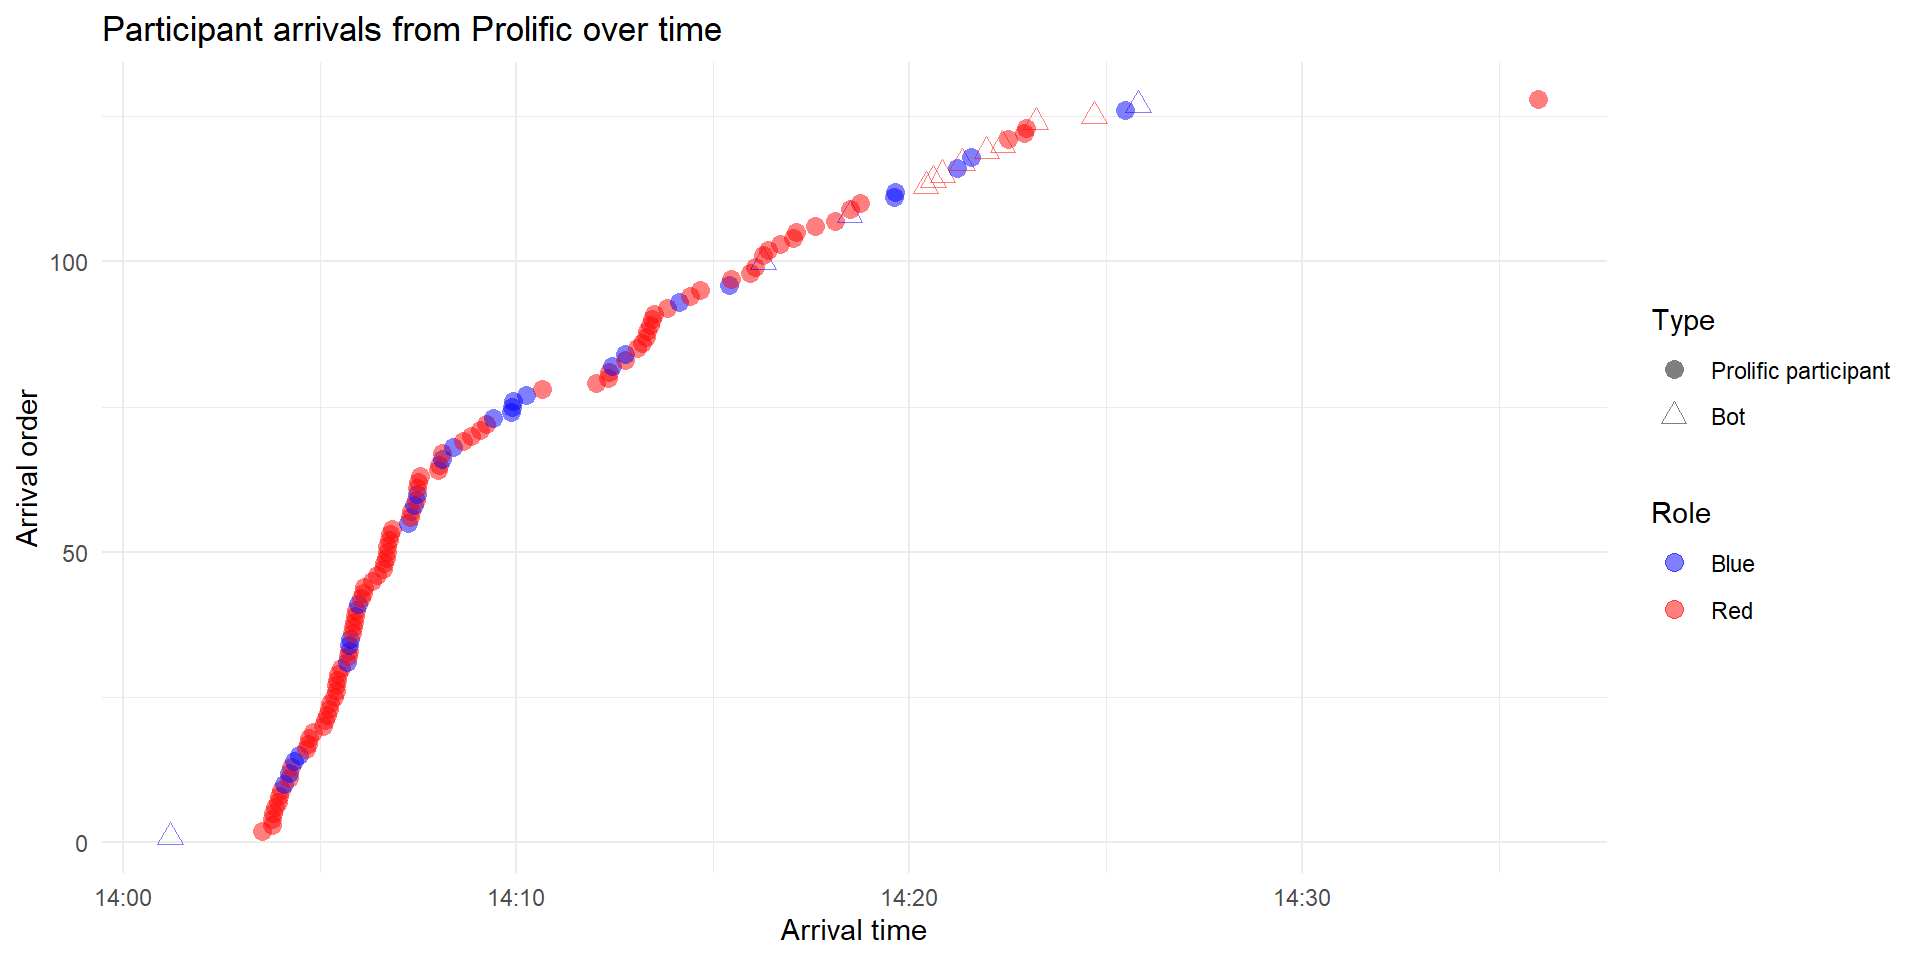
ggplot(test, aes(x = consent_timestamp, y = arrival_order)) + geom_point(aes(color = final_state), size = 3,
    alpha = 0.6) + scale_color_manual(values = c(Participated = "green", `Failed comprehension` = "orange",
    `Could not be grouped` = "red", `Too late` = "gray")) + facet_wrap(~role) + labs(x = "Arrival time",
    y = "Arrival order", color = "Final state", title = "Participant arrivals by role and final state") +
    theme_minimal()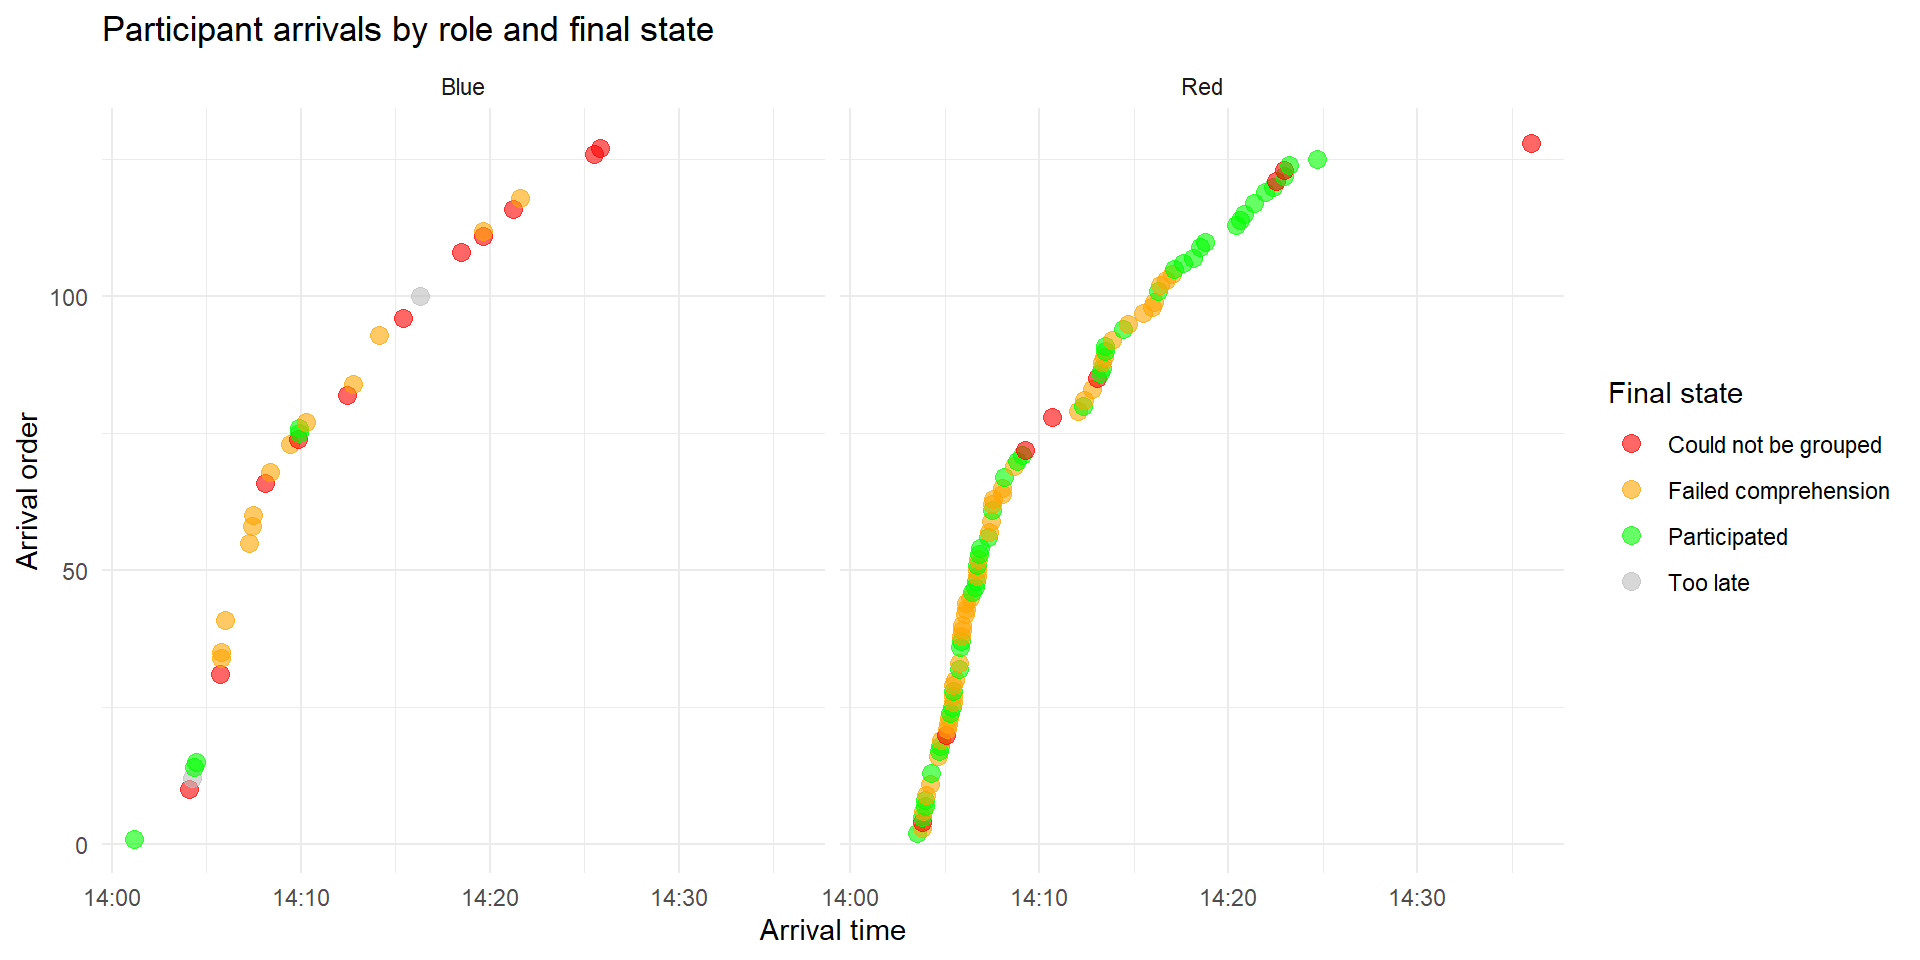
fshowdf(table(test$final_state, test$role), caption = "participant status by role")| Blue | Red | |
|---|---|---|
| Could not be grouped | 11 | 8 |
| Failed comprehension | 13 | 44 |
| Participated | 5 | 45 |
| Too late | 2 | 0 |
3.1.2 progression through the experiment
times <- times %>%
    mutate(timestamp = as_datetime(epoch_time_completed))

arrival_times <- times %>%
    group_by(participant_id_in_session) %>%
    summarize(arrival_time = min(timestamp), .groups = "drop")

times <- times %>%
    left_join(arrival_times, by = "participant_id_in_session") %>%
    mutate(participant_ordered = factor(participant_id_in_session, levels = arrival_times %>%
        arrange(arrival_time) %>%
        pull(participant_id_in_session)))

times_roles <- times %>%
    left_join(test %>%
        select(id_in_session, role), by = c(participant_id_in_session = "id_in_session"))

page_levels <- unique(times$page_name)

times_roles <- times_roles %>%
    mutate(page_name = factor(page_name, levels = page_levels))

custom_colors <- c(InitializeParticipant = "#c6dbef", ConsentPage = "#9ecae1", IntroductionPage = "#6baed6",
    ComprehensionPage = "#3182bd", NetworkFormationWaitPage = "#ffcc99", DecisionPage = "#ff9966", ResultsWaitPage = "#ff6666",
    ResultsPage = "#cc0033", FinalGameResults = "#660000")

# colored y-axis labels based on role
y_labels_colored <- times_roles %>%
    select(participant_ordered, role) %>%
    distinct() %>%
    arrange(participant_ordered) %>%
    mutate(label_colored = case_when(role == "Red" ~ paste0("<span style='color:red'>", participant_ordered,
        "</span>"), role == "Blue" ~ paste0("<span style='color:blue'>", participant_ordered, "</span>"),
        TRUE ~ paste0("<span style='color:darkgrey'>", participant_ordered, "</span>")))

# create a named vector for scale_y_discrete labels
y_labels_vector <- y_labels_colored$label_colored
names(y_labels_vector) <- y_labels_colored$participant_ordered

ggplot(times_roles[times_roles$round_number == 1 & !times_roles$page_name == "Questionnaire", ], aes(x = timestamp,
    y = participant_ordered, color = page_name)) + geom_line(aes(group = participant_id_in_session),
    size = 1) + geom_point(size = 2) + scale_color_manual(values = custom_colors) + scale_y_discrete(labels = y_labels_vector) +
    labs(x = "Time", y = "Participant (ordered by arrival)", color = "Stage/Page", title = "Participant progression through experiment stages (by arrival)") +
    theme_minimal() + theme(axis.text.y = element_markdown(size = 6))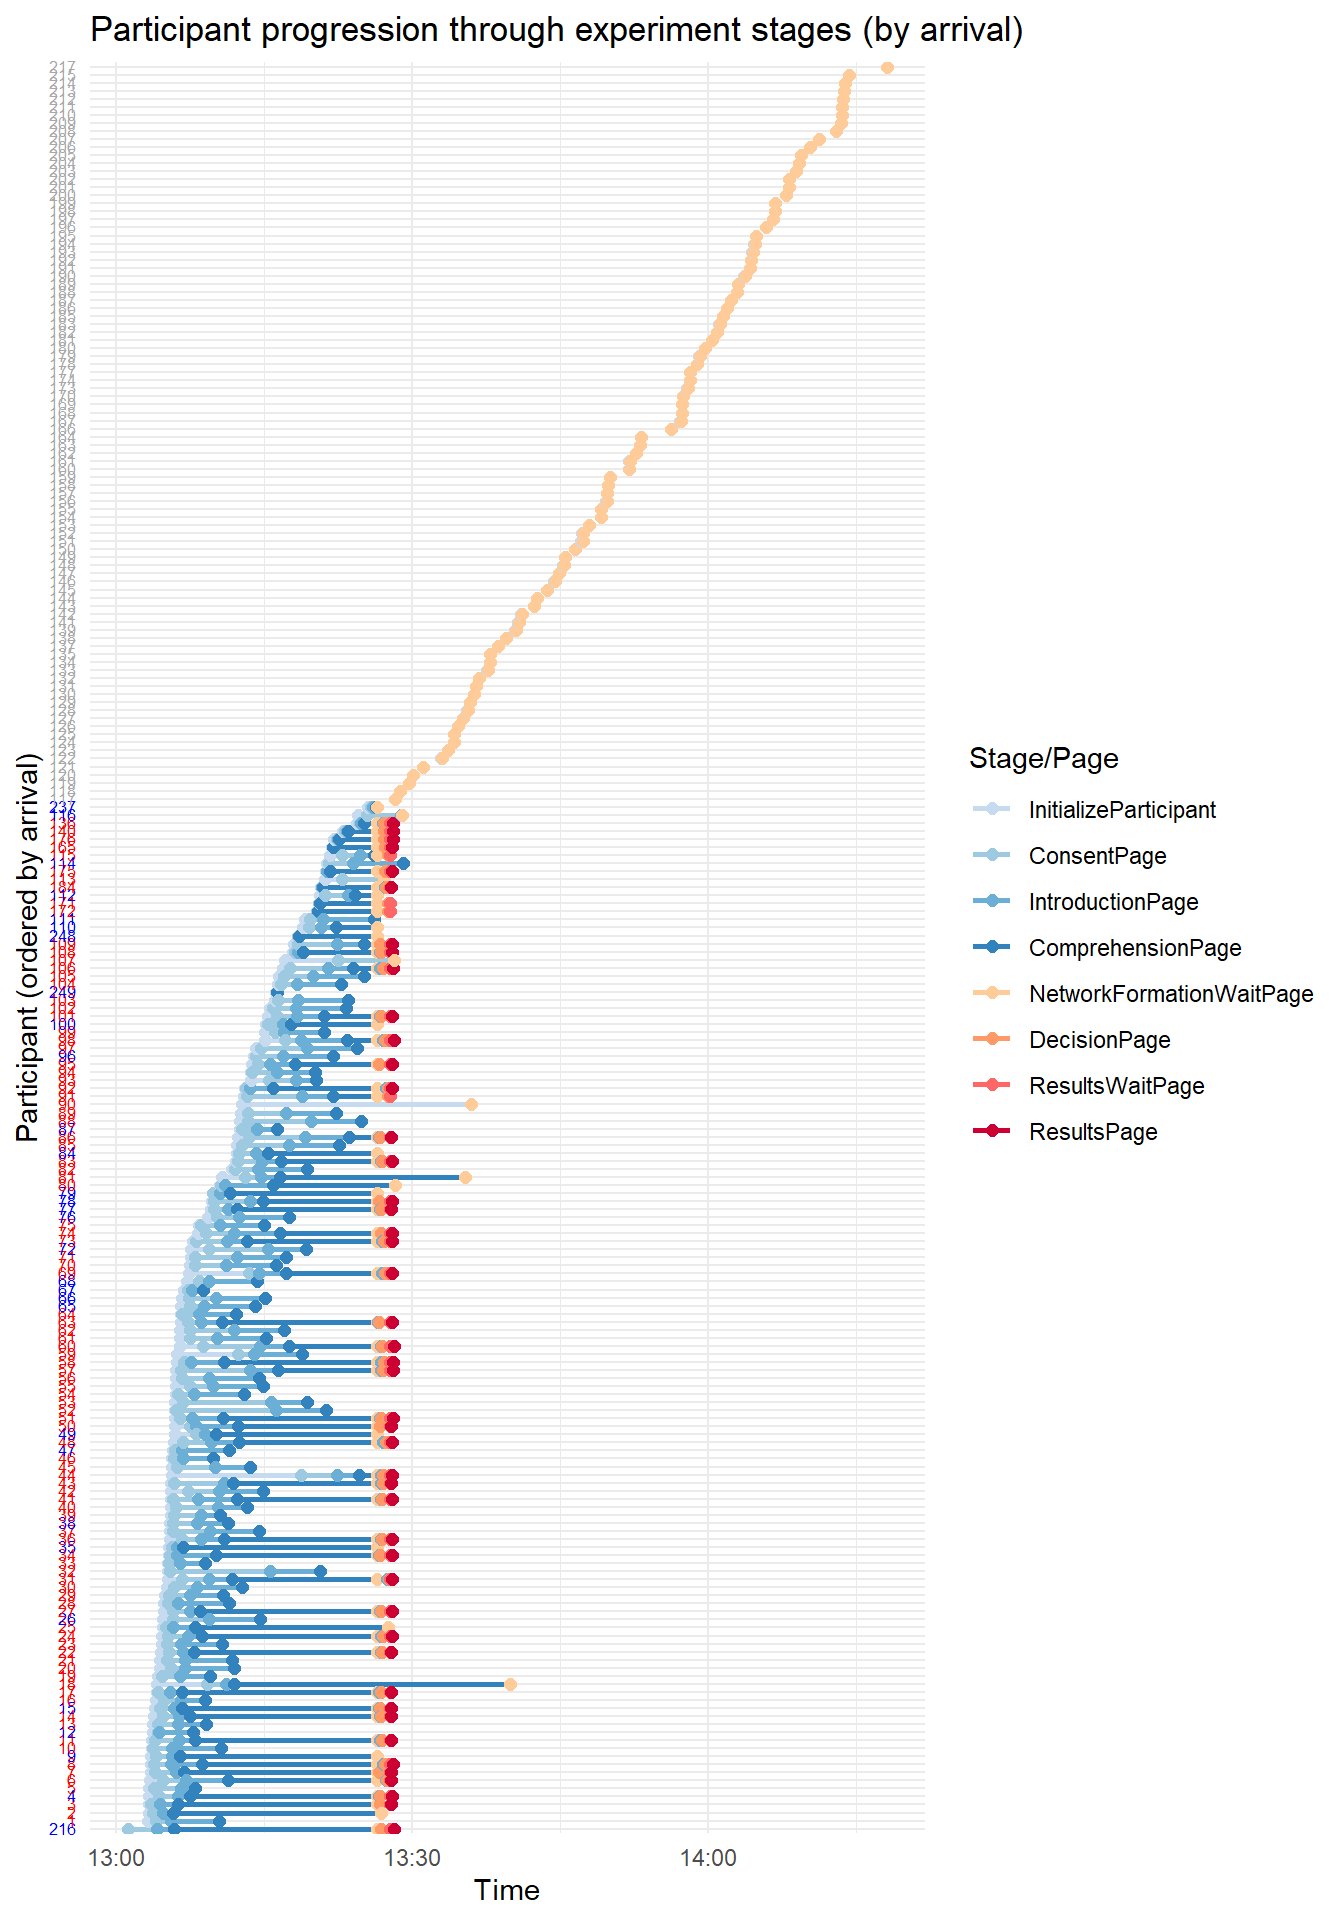
3.1.3 dropout
dropout_long <- data %>%
  filter(participant._current_page_name == "PaymentInfo") %>% # only completed participants
  filter(participant.label != "") %>% # exclude bots (participants controlled by experimener have no label)
  select(
    participant.label,
    participant.role,
    matches("unpop\\.[0-9]+\\.player\\.is_dropout")
  ) %>%
  pivot_longer(
    cols = matches("unpop\\.[0-9]+\\.player\\.is_dropout"),
    names_to = "round",
    values_to = "is_dropout"
  ) %>%
  mutate(
    round = str_extract(round, "[0-9]+"),
    round = as.numeric(round)
  )


# get first dropout round per participant
dropout_summary <- dropout_long %>%
  group_by(participant.label, participant.role) %>%
  summarise(
    event = any(is_dropout == 1, na.rm = TRUE),
    dropout_round = ifelse(
      event,
      min(round[is_dropout == 1], na.rm = TRUE),
      30
    ),
    .groups = "drop"
  )

# count cumulative dropouts
cum_dropout_role <- dropout_summary %>%
  filter(event == TRUE) %>%
  count(participant.role, dropout_round) %>%
  group_by(participant.role) %>%
  complete(dropout_round = 1:30, fill = list(n = 0)) %>%
  arrange(participant.role, dropout_round) %>%
  mutate(
    cumulative_dropout = cumsum(n)
  ) %>%
  ungroup()

ggplot(cum_dropout_role,
       aes(x = dropout_round,
           y = cumulative_dropout,
           color = participant.role)) +
  geom_line(linewidth = 1.2) +
  geom_point() +
  scale_x_continuous(breaks = 1:30) +
  scale_color_manual(
    values = c(
      "Red" = "red",
      "Blue" = "blue"
    )) +
  labs(
    x = "Round",
    y = "Dropout",
    color = "Role",
    title = "Cumulative dropout (by role)"
  ) +
  theme_minimal()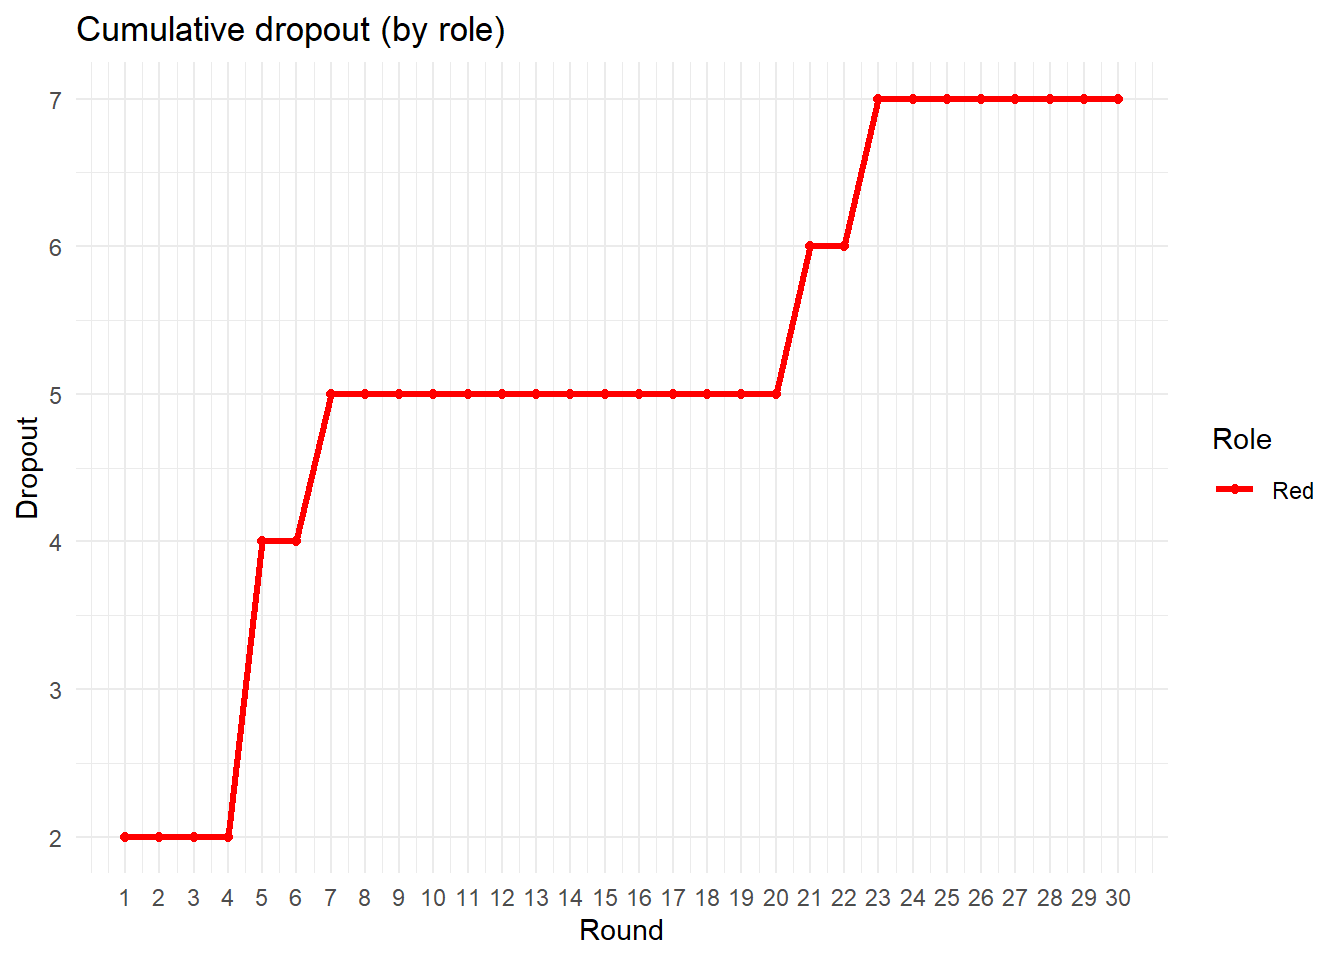
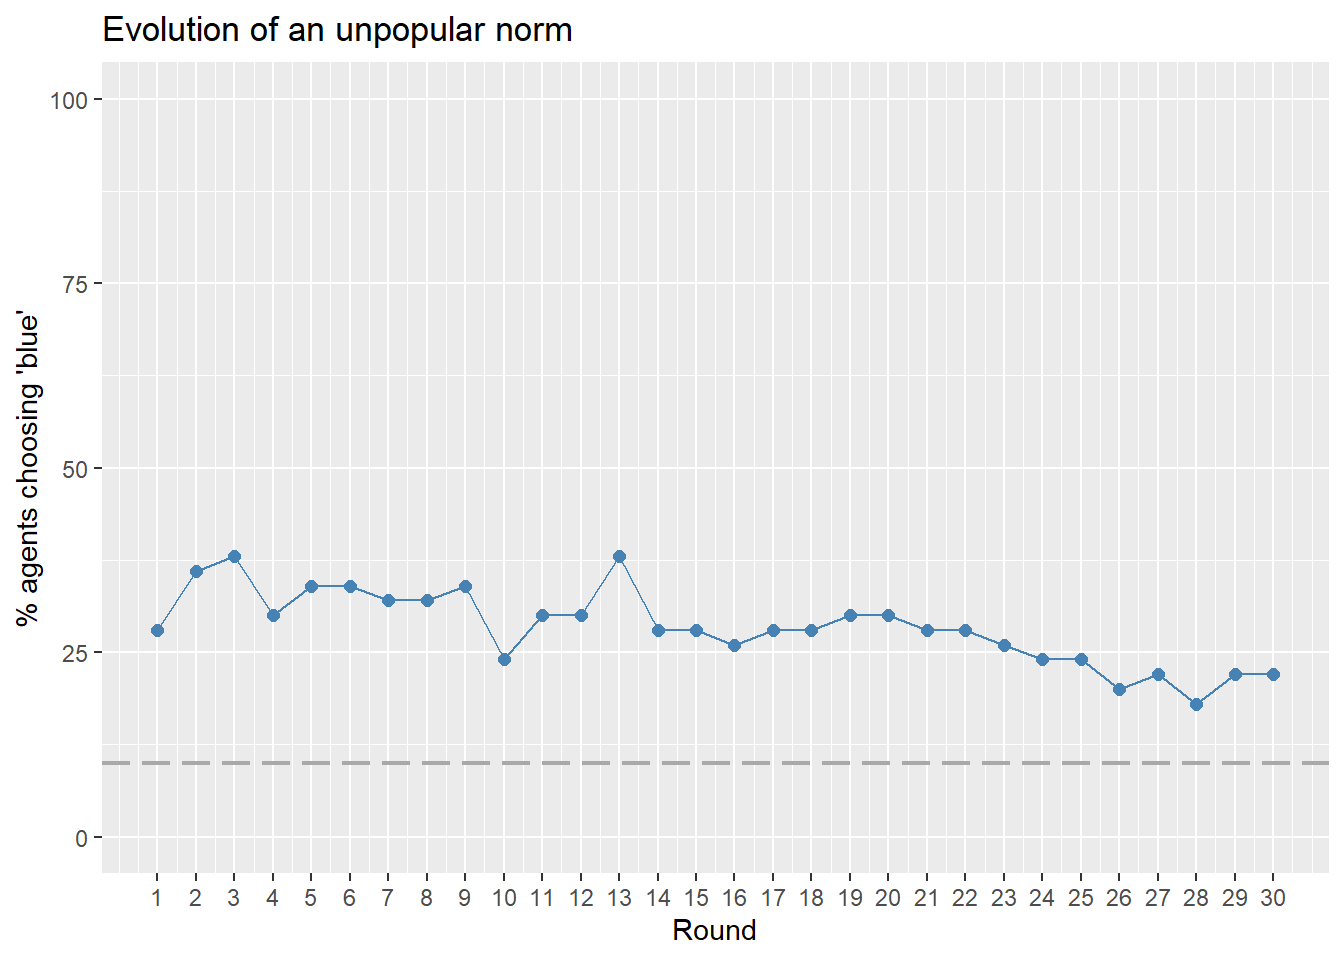
3.2 unpopular norm spread
# choice behavior over rounds:
df_long <- data %>%
  filter(participant._current_page_name == "PaymentInfo") %>% # filter actual participants
  select(participant.label, participant.role, participant.node, starts_with("unpop.")) %>% #also include network node.

  pivot_longer(
    cols = matches("unpop\\.\\d+\\.player\\.choice$"),  # only choice columns
    names_to = "round",
    values_to = "choice"
  ) %>%

  mutate(
    round = as.integer(gsub("unpop\\.(\\d+)\\.player\\.choice", "\\1", round)),
    is_bot = ifelse(participant.label == "", TRUE, FALSE)
  ) %>%
  select(participant.label, participant.node, participant.role, round, choice, is_bot)

# identify round of dropout:
first_dropout <- dropout_long %>%
  filter(is_dropout == 1) %>%
  group_by(participant.label) %>%
  summarise(dropout_round = min(round),
            .groups = "drop")

# and add to the df:
df_long <- df_long %>%
  left_join(first_dropout, by = "participant.label")

# aggregated
df_plot <- df_long %>%
  group_by(round) %>%
  summarise(
    pct_choice1 = mean(choice, na.rm = TRUE) * 100,  # proportion * 100
    n = n()
  )

ggplot(df_plot, aes(x = round, y = pct_choice1)) +
  geom_line(group = 1, color = "steelblue", size = .5) +
  geom_point(color = "steelblue", size = 2) +
   geom_hline(yintercept = 10, linetype = "longdash", color = "darkgrey", size = 0.8) +  # dashed line at 10
  scale_x_continuous(breaks = df_plot$round) +
  scale_y_continuous(limits = c(0, 100)) +
  labs(
    x = "Round",
    y = "% agents choosing 'blue'",
    title = "Evolution of an unpopular norm"
  )
#sort by node
df_long <- df_long %>%
  arrange(participant.node) %>%
  select(-participant.label)

df_long$dropout_round[is.na(df_long$dropout_round)] <- 30 #non dropouts, set to 30.
# make roles consistent with utility function roles
df_long$role <- ifelse(df_long$participant.role == "Blue", "trendsetter", "conformist")
# specificy incentive structure parameters
params = list(s = 15, e = 10, w = 40, z = 50, lambda1 = 5, lambda2 = 1.8)
df_long$id <- df_long$participant.node + 1 #nodes are 0-indexed
#add degree
deg <- degree(g)
df_long <- df_long %>%
mutate(degree = deg[id])
calculate_round_utilities <- function(current_round, df_long, network, params) {
# previous round data
df_prev <- df_long %>%
filter(round == current_round - 1) %>%
select(id, role, choice)
# current round data
df_curr <- df_long %>%
filter(round == current_round)
# compute utilities
df_curr <- df_curr %>%
rowwise() %>%
mutate(
util_0 = futility(agent_id = id, choice = 0,
agents = df_prev,
network = network,
params = params)$utility,
util_1 = futility(agent_id = id, choice = 1,
agents = df_prev,
network = network,
params = params)$utility
) %>%
ungroup()
return(df_curr)
}
##calculate_round_utilities(2, df_long, network = g, params = params)
#compute utilities for all rounsd (except round 1)
max_round <- max(df_long$round)
df <- map_dfr(2:max_round, ~calculate_round_utilities(.x, df_long, g, params))
# identify best replies
df <- df %>%
mutate(
predicted_choice = ifelse(util_1 > util_0, 1, 0),
best_reply = (choice == predicted_choice) # TRUE if agent picked the choice with highest utility
)
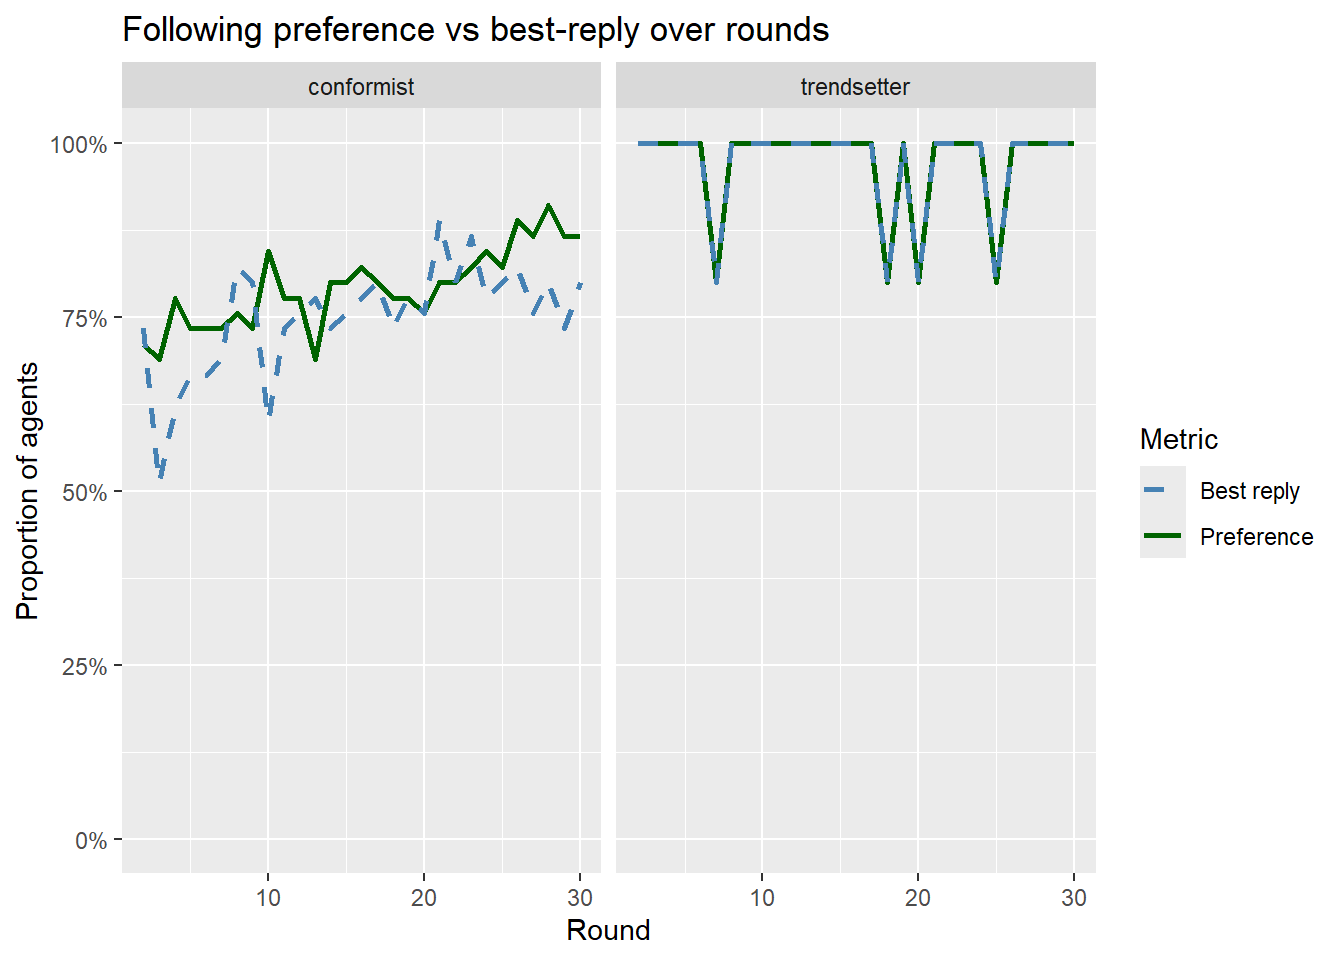
df_summary <- df %>%
mutate(
preferred_choice = ifelse(role == "trendsetter", 1, 0), # define preferred option by role
chose_preferred = (choice == preferred_choice) # TRUE if they picked their preferred option
) %>%
group_by(round, role) %>%
summarize(
n_agents = n(),
prop_preferred = mean(chose_preferred), # fraction that chose their preferred option
prop_best_reply = mean(best_reply), # fraction that picked the highest-utility choice
.groups = "drop"
)
ggplot(df_summary, aes(x = round)) +
geom_line(aes(y = prop_preferred, color = "Preference"), size = 1) +
geom_line(aes(y = prop_best_reply, color = "Best reply"), size = 1, linetype = "dashed") +
facet_wrap(~role) +
scale_y_continuous(labels = scales::percent_format(accuracy = 1), limits = c(0,1)) +
scale_color_manual(values = c("Preference" = "darkgreen", "Best reply" = "steelblue")) +
labs(
x = "Round",
y = "Proportion of agents",
color = "Metric",
title = "Following preference vs best-reply over rounds"
)
LS0tDQp0aXRsZTogIkV4cGVyaW1lbnQiDQpiaWJsaW9ncmFwaHk6IHJlZmVyZW5jZXMuYmliDQpsaW5rLWNpdGF0aW9uczogdHJ1ZQ0KZGF0ZTogIkxhc3QgY29tcGlsZWQgb24gYHIgZm9ybWF0KFN5cy50aW1lKCksICclZC0lbS0lWScpYCINCm91dHB1dDogDQogIGh0bWxfZG9jdW1lbnQ6DQogICAgc2VsZl9jb250YWluZWQ6IHRydWUNCiAgICBjc3M6IHR3ZWFrcy5jc3MNCiAgICB0b2M6IHRydWUNCiAgICB0b2NfZmxvYXQ6IHRydWUNCiAgICBudW1iZXJfc2VjdGlvbnM6IHRydWUNCiAgICB0b2NfZGVwdGg6IDQNCiAgICBjb2RlX2ZvbGRpbmc6IHNob3cNCiAgICBjb2RlX2Rvd25sb2FkOiB5ZXMNCi0tLQ0KDQpgYGB7ciwgZ2xvYmFsc2V0dGluZ3MsIGVjaG89RkFMU0UsIHdhcm5pbmc9RkFMU0UsIHJlc3VsdHM9J2hpZGUnLCBtZXNzYWdlPUZBTFNFfQ0KbGlicmFyeShrbml0cikNCmxpYnJhcnkodGlkeXZlcnNlKQ0Ka25pdHI6Om9wdHNfY2h1bmskc2V0KGVjaG8gPSBUUlVFKQ0Kb3B0c19jaHVuayRzZXQodGlkeS5vcHRzPWxpc3Qod2lkdGguY3V0b2ZmPTEwMCksdGlkeT1UUlVFLCB3YXJuaW5nID0gRkFMU0UsIG1lc3NhZ2UgPSBGQUxTRSxjb21tZW50ID0gIiM+IiwgY2FjaGU9VFJVRSwgY2xhc3Muc291cmNlPWMoInRlc3QiKSwgY2xhc3Mub3V0cHV0PWMoInRlc3QzIikpDQpvcHRpb25zKHdpZHRoID0gMTAwKQ0KcmdsOjpzZXR1cEtuaXRyKCkNCg0KY29sb3JpemUgPC0gZnVuY3Rpb24oeCwgY29sb3IpIHtzcHJpbnRmKCI8c3BhbiBzdHlsZT0nY29sb3I6ICVzOyc+JXM8L3NwYW4+IiwgY29sb3IsIHgpIH0NCmBgYA0KDQpgYGB7ciBrbGlwcHksIGVjaG89RkFMU0UsIGluY2x1ZGU9VFJVRX0NCmtsaXBweTo6a2xpcHB5KHBvc2l0aW9uID0gYygndG9wJywgJ3JpZ2h0JykpDQoja2xpcHB5OjprbGlwcHkoY29sb3IgPSAnZGFya3JlZCcpDQoja2xpcHB5OjprbGlwcHkodG9vbHRpcF9tZXNzYWdlID0gJ0NsaWNrIHRvIGNvcHknLCB0b29sdGlwX3N1Y2Nlc3MgPSAnRG9uZScpDQpgYGANCg0KLS0tDQoNCiMgR2V0dGluZyBzdGFydGVkDQoNClRvIGNvcHkgdGhlIGNvZGUsIGNsaWNrIHRoZSBidXR0b24gaW4gdGhlIHVwcGVyIHJpZ2h0IGNvcm5lciBvZiB0aGUgY29kZS1jaHVua3MuDQoNCiMjIGNsZWFuIHVwDQoNCmBgYHtyLCBjbGVhbl91cCwgcmVzdWx0cz0naGlkZSd9DQpybShsaXN0PWxzKCkpDQpnYygpDQpgYGANCg0KPGJyPg0KDQojIyBjdXN0b20gZnVuY3Rpb25zDQoNCldlIGRlZmluZWQgYSBudW1iZXIgY3VzdG9tIGZ1bmN0aW9ucywgYXQgYHIgeGZ1bjo6ZW1iZWRfZmlsZSgiLi9jdXN0b21fZnVuY3Rpb25zLlIiKWAuDQoNCmBgYHtyLCBjdXN0b21fZnVuY3Rpb25zfQ0Kc291cmNlKCIuL2N1c3RvbV9mdW5jdGlvbnMuUiIpDQpgYGANCg0KPGJyPg0KDQojIyBuZWNlc3NhcnkgcGFja2FnZXMNCg0KLSBgdGlkeXZlcnNlYDogZGF0YSB3cmFuZ2xpbmcNCi0gYGlncmFwaGA6IGdlbmVyYXRlIGFuZCB2aXN1YWxpemUgZ3JhcGhzDQotIGBwYXJhbGxlbGA6IHBhcmFsbGVsIGNvbXB1dGluZyB0byBzcGVlZCB1cCBzaW11bGF0aW9uDQotIGBmb3JlYWNoYDogbG9vcGluZyBpbiBwYXJhbGxlbA0KLSBgZG9QYXJhbGxlbGA6IHBhcmFsbGVsIGJhY2tlbmQgZm9yIGBmb3JlYWNoYA0KLSBgZ2dwbG90MmA6IGRhdGEgdmlzdWFsaXphdGlvbg0KLSBgZ2doNHhgOiBoYWNrcyBmb3IgYGdncGxvdDJgDQotIGBnZ3B1YnJgOiBtYWtlIHZpc3VhbGl6YXRpb25zIHB1YmxpY2F0aW9uLXJlYWR5DQoNCg0KYGBge3IsIHBhY2thZ2VzfQ0KcGFja2FnZXMgPSBjKCJ0aWR5dmVyc2UiLCAiaWdyYXBoIiwgImdncGxvdDIiLCAicGFyYWxsZWwiLCAiZG9QYXJhbGxlbCIsICJmb3JlYWNoIiwgImdnaDR4IiwgImdncHViciIsICJwbG90bHkiLCAiUkNvbG9yQnJld2VyIiwgImdyaWQiLCAiZ3JpZEV4dHJhIiwgInBhdGNod29yayIsICJnZ3Bsb3RpZnkiLCAiZ2dyYXBoIiwgImdnYW5pbWF0ZSIsICJSQ29sb3JCcmV3ZXIiLA0KICAgICJnZ3RleHQiLCAibWFnaWNrIiwgImpzb25saXRlIiwgImx1YnJpZGF0ZSIsICJnZ3RleHQiKQ0KDQppbnZpc2libGUoZnBhY2thZ2UuY2hlY2socGFja2FnZXMpKQ0Kcm0ocGFja2FnZXMpDQpgYGANCg0KLS0tDQoNCiMgaW1wb3J0IGRhdGENCg0KYGBge3J9DQpkYXRhIDwtIHJlYWQuY3N2KCIuL3Jhd2RhdGEvYWxsX2FwcHNfd2lkZV8yMDI2LTAyLTIzLmNzdiIpDQp0aW1lcyA8LSByZWFkLmNzdigiLi9yYXdkYXRhL1BhZ2VUaW1lcy0yMDI2LTAyLTIzLmNzdiIpDQoNCnRhYmxlKGRhdGEkc3VydmV5LjEucGxheWVyLmNsYXJpdHkpDQp0YWJsZShkYXRhJHN1cnZleS4xLnBsYXllci5lbmpveW1lbnQpDQp0YWJsZShkYXRhJHN1cnZleS4xLnBsYXllci5zdHJhdGVneSkNCg0KdGFibGUoZGF0YSRzdXJ2ZXkuMS5wbGF5ZXIuY29tbWVudHMpDQp0YWJsZShkYXRhJHN1cnZleS4xLnBsYXllci5wZXJjZWl2ZWRfcnEpDQp0YWJsZShkYXRhJHN1cnZleS4xLnBsYXllci5tYWpvcml0eSkNCg0KDQojY2JpbmQoZGF0YSRwYXJ0aWNpcGFudC5ub2RlLGRhdGEkcGFydGljaXBhbnQucm9sZSlbY29tcGxldGUuY2FzZXMoIGNiaW5kKGRhdGEkcGFydGljaXBhbnQubm9kZSxkYXRhJHBhcnRpY2lwYW50LnJvbGUpKSxdDQoNCiNib251cyA8LSBkYXRhWywgYygicGFydGljaXBhbnQuYm9udXMiLCAicGFydGljaXBhbnQubGFiZWwiKV1bIWlzLm5hKGRhdGEkcGFydGljaXBhbnQuYm9udXMpLF0NCiNyb3cubmFtZXMoYm9udXMpIDwtIGMoMTpucm93KGJvbnVzKSkNCg0KI2JvbnVzX2ZpbGUgPC0gYm9udXMgJT4lDQojICBzZWxlY3QocGFydGljaXBhbnQubGFiZWwsIHBhcnRpY2lwYW50LmJvbnVzKQ0KDQojd3JpdGUudGFibGUoDQojICBib251c19maWxlLA0KIyAgZmlsZSA9ICJwcm9saWZpY19ib251cy5jc3YiLA0KIyAgc2VwID0gIiwiLA0KIyAgcm93Lm5hbWVzID0gRkFMU0UsDQojICBjb2wubmFtZXMgPSBGQUxTRSwNCiMgIHF1b3RlID0gRkFMU0UNCiMpDQoNCmBgYA0KDQotLS0NCg0KIyByZXN1bHRzDQoNCk9uIDIzLTItMjAyNiwgSSByZWNydWl0ZWQgODAgUHJvbGlmaWMgcGFydGljaXBhbnRzLCB0byBwb3B1bGF0ZSBhIG5ldHdvcmsgb2YgTj01MCAod2l0aCBhIDEwJSBtaW5vcml0eSBncm91cCkuDQoNCmBgYHtyLCBjbGFzcy5zb3VyY2UgPSAnZm9sZC1oaWRlJ30NCm5ldCA8LSBqc29ubGl0ZTo6ZnJvbUpTT04oIi4vbmV0d29ya3MvbmV0d29ya190ZXN0X241MC5qc29uIikNCg0KZyA8LSBncmFwaF9mcm9tX2FkamFjZW5jeV9tYXRyaXgobmV0JGFkal9tYXRyaXgsIG1vZGUgPSAidW5kaXJlY3RlZCIpDQpWKGcpJHJvbGUgPC0gaWZlbHNlKG5ldCRyb2xlX3ZlY3RvciA9PSAxLCAidHJlbmRzZXR0ZXIiLCAiY29uZm9ybWlzdCIpDQoNCmZwbG90X2dyYXBoKGcgKQ0KYGBgDQoNCg0KPGJyPg0KDQojIyBkaWFnbm9zdGljcw0KDQojIyMgYXJyaXZhbCBmcm9tIFByb2xpZmljDQoNCmBgYHtyLCBmaWcud2lkdGg9MTAsIGNsYXNzLnNvdXJjZSA9ICdmb2xkLWhpZGUnfQ0KIyBzdWJzZXQgZXhwZXJpbWVudGFsIHNlc3Npb24NCmRhdGEgPC0gZGF0YVtkYXRhJHNlc3Npb24uY29kZSA9PSAiMjY2cmE0dHIiLF0NCnRpbWVzIDwtIHRpbWVzW3RpbWVzJHNlc3Npb25fY29kZSA9PSAiMjY2cmE0dHIiLF0NCg0KI2NsZWFuDQp0ZXN0IDwtIGRhdGEgJT4lDQogIHRyYW5zbXV0ZSgNCiAgICBwYXJ0aWNpcGFudF9pZCA9IHBhcnRpY2lwYW50LmNvZGUsDQogICAgcGFydGljaXBhbnRfbGFiZWwgPSBwYXJ0aWNpcGFudC5sYWJlbCwNCiAgICBpZF9pbl9zZXNzaW9uICA9IHBhcnRpY2lwYW50LmlkX2luX3Nlc3Npb24sDQogICAgY29uc2VudF9naXZlbiA9IGNvbnNlbnQuMS5wbGF5ZXIuY29uc2VudCwNCiAgICBjb25zZW50X3RpbWVzdGFtcCA9IGNvbnNlbnQuMS5wbGF5ZXIuY29uc2VudF90aW1lc3RhbXAsDQogICAgcm9sZSA9IHBhcnRpY2lwYW50LnJvbGUsDQogICAgaXNfZHJvcG91dCA9IHBhcnRpY2lwYW50LmlzX2Ryb3BvdXQsDQogICAgZHJvcG91dF9hcHAgPSBwYXJ0aWNpcGFudC5fY3VycmVudF9hcHBfbmFtZSwNCiAgICBjb21wcmVoZW5zaW9uX3JldHJpZXMgPSBjb21wcmVoZW5zaW9uLjEucGxheWVyLmNvbXByZWhlbnNpb25fcmV0cmllcywNCiAgICBwYXNzZWRfY29tcHJlaGVuc2lvbiA9ICFwYXJ0aWNpcGFudC5fY3VycmVudF9hcHBfbmFtZSAlaW4lIGMoImNvbnNlbnQiLCAiY29tcHJlaGVuc2lvbiIpLA0KICAgIGNob2ljZSA9IHVucG9wLjEucGxheWVyLmNob2ljZSwNCiAgICBmYWlsZWRfY2hlY2tzID0gcGFydGljaXBhbnQuZmFpbGVkX2NoZWNrcywNCiAgICBleGl0X2Vhcmx5ID0gcGFydGljaXBhbnQuZXhpdF9lYXJseSwNCiAgICBwYXJ0aWNpcGF0ZWQgPSBwYXJ0aWNpcGFudC5fY3VycmVudF9wYWdlX25hbWUgPT0gIlBheW1lbnRJbmZvIg0KICApICU+JQ0KICBmaWx0ZXIoIWlzLm5hKGNvbnNlbnRfZ2l2ZW4pKSAlPiUNCiAgbXV0YXRlKA0KICAgIGJvdCA9IGlmZWxzZShwYXJ0aWNpcGFudF9sYWJlbCA9PSAiIiwgMSwgMCksDQogICAgYm90ID0gZmFjdG9yKGJvdCwgbGV2ZWxzID0gYygwLCAxKSwgbGFiZWxzID0gYygiUHJvbGlmaWMgcGFydGljaXBhbnQiLCAiQm90IikpLA0KICAgIGNvbnNlbnRfdGltZXN0YW1wID0geW1kX2htcyhjb25zZW50X3RpbWVzdGFtcCksDQogICAgZmluYWxfc3RhdGUgPSBjYXNlX3doZW4oDQogICAgICBmYWlsZWRfY2hlY2tzID4gMCB+ICJGYWlsZWQgY29tcHJlaGVuc2lvbiIsDQogICAgICBleGl0X2Vhcmx5ID09IDEgfiAiQ291bGQgbm90IGJlIGdyb3VwZWQiLA0KICAgICAgcGFydGljaXBhdGVkIH4gIlBhcnRpY2lwYXRlZCIsDQogICAgICBUUlVFIH4gIlRvbyBsYXRlIg0KICAgICkNCiAgKSAlPiUNCiAgYXJyYW5nZShjb25zZW50X3RpbWVzdGFtcCkgJT4lDQogIG11dGF0ZShhcnJpdmFsX29yZGVyID0gcm93X251bWJlcigpKQ0KDQpnZ3Bsb3QodGVzdCwgYWVzKHggPSBjb25zZW50X3RpbWVzdGFtcCwgeSA9IGFycml2YWxfb3JkZXIpKSArDQogIGdlb21fcG9pbnQoYWVzKGNvbG9yID0gcm9sZSwgc2hhcGUgPSBib3QpLCBzaXplID0gMywgYWxwaGEgPSAwLjUpICsNCiAgc2NhbGVfc2hhcGVfbWFudWFsKHZhbHVlcyA9IGMoMTYsIDIpKSArICAgICAgICAgICAgIA0KICBzY2FsZV9jb2xvcl9tYW51YWwodmFsdWVzID0gYygiYmx1ZSIsICJyZWQiKSkgKyAgIA0KICBsYWJzKA0KICAgIHggPSAiQXJyaXZhbCB0aW1lIiwNCiAgICB5ID0gIkFycml2YWwgb3JkZXIiLA0KICAgIGNvbG9yID0gIlJvbGUiLA0KICAgIHNoYXBlID0gIlR5cGUiLA0KICAgIHRpdGxlID0gIlBhcnRpY2lwYW50IGFycml2YWxzIGZyb20gUHJvbGlmaWMgb3ZlciB0aW1lIg0KICApICsNCiAgdGhlbWVfbWluaW1hbCgpDQoNCmdncGxvdCh0ZXN0LCBhZXMoeCA9IGNvbnNlbnRfdGltZXN0YW1wLCB5ID0gYXJyaXZhbF9vcmRlcikpICsNCiAgZ2VvbV9wb2ludChhZXMoY29sb3IgPSBmaW5hbF9zdGF0ZSksIHNpemUgPSAzLCBhbHBoYSA9IDAuNikgKw0KICBzY2FsZV9jb2xvcl9tYW51YWwodmFsdWVzID0gYygNCiAgICAiUGFydGljaXBhdGVkIiA9ICJncmVlbiIsDQogICAgIkZhaWxlZCBjb21wcmVoZW5zaW9uIiA9ICJvcmFuZ2UiLA0KICAgICJDb3VsZCBub3QgYmUgZ3JvdXBlZCIgPSAicmVkIiwNCiAgICAiVG9vIGxhdGUiID0gImdyYXkiDQogICkpICsNCiAgZmFjZXRfd3JhcCh+cm9sZSkgKw0KICBsYWJzKA0KICAgIHggPSAiQXJyaXZhbCB0aW1lIiwNCiAgICB5ID0gIkFycml2YWwgb3JkZXIiLA0KICAgIGNvbG9yID0gIkZpbmFsIHN0YXRlIiwNCiAgICB0aXRsZSA9ICJQYXJ0aWNpcGFudCBhcnJpdmFscyBieSByb2xlIGFuZCBmaW5hbCBzdGF0ZSINCiAgKSArDQogIHRoZW1lX21pbmltYWwoKQ0KDQpmc2hvd2RmKHRhYmxlKHRlc3QkZmluYWxfc3RhdGUsIHRlc3Qkcm9sZSksIGNhcHRpb24gPSAicGFydGljaXBhbnQgc3RhdHVzIGJ5IHJvbGUiKQ0KYGBgDQoNCjxicj4NCg0KIyMjIHByb2dyZXNzaW9uIHRocm91Z2ggdGhlIGV4cGVyaW1lbnQNCg0KYGBge3IsIGZpZy5oZWlnaHQ9MTAsIGNsYXNzLnNvdXJjZSA9ICdmb2xkLWhpZGUnfQ0KdGltZXMgPC0gdGltZXMgJT4lDQogIG11dGF0ZSgNCiAgICB0aW1lc3RhbXAgPSBhc19kYXRldGltZShlcG9jaF90aW1lX2NvbXBsZXRlZCkNCiAgKQ0KDQphcnJpdmFsX3RpbWVzIDwtIHRpbWVzICU+JQ0KICBncm91cF9ieShwYXJ0aWNpcGFudF9pZF9pbl9zZXNzaW9uKSAlPiUNCiAgc3VtbWFyaXplKGFycml2YWxfdGltZSA9IG1pbih0aW1lc3RhbXApLCAuZ3JvdXBzID0gImRyb3AiKQ0KDQp0aW1lcyA8LSB0aW1lcyAlPiUNCiAgbGVmdF9qb2luKGFycml2YWxfdGltZXMsIGJ5ID0gInBhcnRpY2lwYW50X2lkX2luX3Nlc3Npb24iKSAlPiUNCiAgbXV0YXRlKHBhcnRpY2lwYW50X29yZGVyZWQgPSBmYWN0b3IocGFydGljaXBhbnRfaWRfaW5fc2Vzc2lvbiwgDQogICAgICAgICAgICAgICAgICAgICAgICAgICAgICAgICAgICAgIGxldmVscyA9IGFycml2YWxfdGltZXMgJT4lIGFycmFuZ2UoYXJyaXZhbF90aW1lKSAlPiUgcHVsbChwYXJ0aWNpcGFudF9pZF9pbl9zZXNzaW9uKSkpDQoNCnRpbWVzX3JvbGVzIDwtIHRpbWVzICU+JQ0KICBsZWZ0X2pvaW4oDQogICAgdGVzdCAlPiUgc2VsZWN0KGlkX2luX3Nlc3Npb24sIHJvbGUpLA0KICAgIGJ5ID0gYygicGFydGljaXBhbnRfaWRfaW5fc2Vzc2lvbiIgPSAiaWRfaW5fc2Vzc2lvbiIpDQogICkNCg0KcGFnZV9sZXZlbHMgPC0gdW5pcXVlKHRpbWVzJHBhZ2VfbmFtZSkNCg0KdGltZXNfcm9sZXMgPC0gdGltZXNfcm9sZXMgJT4lDQogIG11dGF0ZShwYWdlX25hbWUgPSBmYWN0b3IocGFnZV9uYW1lLCBsZXZlbHMgPSBwYWdlX2xldmVscykpDQoNCmN1c3RvbV9jb2xvcnMgPC0gYygNCiAgIkluaXRpYWxpemVQYXJ0aWNpcGFudCIgPSAiI2M2ZGJlZiIsIA0KICAiQ29uc2VudFBhZ2UiID0gIiM5ZWNhZTEiLA0KICAiSW50cm9kdWN0aW9uUGFnZSIgPSAiIzZiYWVkNiIsDQogICJDb21wcmVoZW5zaW9uUGFnZSIgPSAiIzMxODJiZCIsDQogICJOZXR3b3JrRm9ybWF0aW9uV2FpdFBhZ2UiID0gIiNmZmNjOTkiLA0KICAiRGVjaXNpb25QYWdlIiA9ICIjZmY5OTY2IiwNCiAgIlJlc3VsdHNXYWl0UGFnZSIgPSAiI2ZmNjY2NiIsDQogICJSZXN1bHRzUGFnZSIgPSAiI2NjMDAzMyIsDQogICJGaW5hbEdhbWVSZXN1bHRzIiA9ICIjNjYwMDAwIg0KKQ0KDQojY29sb3JlZCB5LWF4aXMgbGFiZWxzIGJhc2VkIG9uIHJvbGUNCnlfbGFiZWxzX2NvbG9yZWQgPC0gdGltZXNfcm9sZXMgJT4lDQogIHNlbGVjdChwYXJ0aWNpcGFudF9vcmRlcmVkLCByb2xlKSAlPiUNCiAgZGlzdGluY3QoKSAlPiUNCiAgYXJyYW5nZShwYXJ0aWNpcGFudF9vcmRlcmVkKSAlPiUNCiAgbXV0YXRlKA0KICAgIGxhYmVsX2NvbG9yZWQgPSBjYXNlX3doZW4oDQogICAgICByb2xlID09ICJSZWQiIH4gcGFzdGUwKCI8c3BhbiBzdHlsZT0nY29sb3I6cmVkJz4iLCBwYXJ0aWNpcGFudF9vcmRlcmVkLCAiPC9zcGFuPiIpLA0KICAgICAgcm9sZSA9PSAiQmx1ZSIgfiBwYXN0ZTAoIjxzcGFuIHN0eWxlPSdjb2xvcjpibHVlJz4iLCBwYXJ0aWNpcGFudF9vcmRlcmVkLCAiPC9zcGFuPiIpLA0KICAgICAgVFJVRSB+IHBhc3RlMCgiPHNwYW4gc3R5bGU9J2NvbG9yOmRhcmtncmV5Jz4iLCBwYXJ0aWNpcGFudF9vcmRlcmVkLCAiPC9zcGFuPiIpDQogICAgKQ0KICApDQoNCiMgY3JlYXRlIGEgbmFtZWQgdmVjdG9yIGZvciBzY2FsZV95X2Rpc2NyZXRlIGxhYmVscw0KeV9sYWJlbHNfdmVjdG9yIDwtIHlfbGFiZWxzX2NvbG9yZWQkbGFiZWxfY29sb3JlZA0KbmFtZXMoeV9sYWJlbHNfdmVjdG9yKSA8LSB5X2xhYmVsc19jb2xvcmVkJHBhcnRpY2lwYW50X29yZGVyZWQNCg0KZ2dwbG90KHRpbWVzX3JvbGVzW3RpbWVzX3JvbGVzJHJvdW5kX251bWJlciA9PSAxICYgIXRpbWVzX3JvbGVzJHBhZ2VfbmFtZSA9PSAiUXVlc3Rpb25uYWlyZSIsXSwgYWVzKHggPSB0aW1lc3RhbXAsIHkgPSBwYXJ0aWNpcGFudF9vcmRlcmVkLCBjb2xvciA9IHBhZ2VfbmFtZSkpICsNCiAgZ2VvbV9saW5lKGFlcyhncm91cCA9IHBhcnRpY2lwYW50X2lkX2luX3Nlc3Npb24pLCBzaXplID0gMSkgKw0KICBnZW9tX3BvaW50KHNpemUgPSAyKSArDQogIHNjYWxlX2NvbG9yX21hbnVhbCh2YWx1ZXMgPSBjdXN0b21fY29sb3JzKSArDQogIHNjYWxlX3lfZGlzY3JldGUobGFiZWxzID0geV9sYWJlbHNfdmVjdG9yKSArDQogIGxhYnMoDQogICAgeCA9ICJUaW1lIiwNCiAgICB5ID0gIlBhcnRpY2lwYW50IChvcmRlcmVkIGJ5IGFycml2YWwpIiwNCiAgICBjb2xvciA9ICJTdGFnZS9QYWdlIiwNCiAgICB0aXRsZSA9ICJQYXJ0aWNpcGFudCBwcm9ncmVzc2lvbiB0aHJvdWdoIGV4cGVyaW1lbnQgc3RhZ2VzIChieSBhcnJpdmFsKSINCiAgKSArDQogIHRoZW1lX21pbmltYWwoKSArDQogIHRoZW1lKGF4aXMudGV4dC55ID0gZWxlbWVudF9tYXJrZG93bihzaXplID0gNikpDQpgYGAgDQoNCiMjIyBkcm9wb3V0DQoNCg0KYGBge3IsIGNsYXNzLnNvdXJjZSA9ICdmb2xkLWhpZGUnfQ0KZHJvcG91dF9sb25nIDwtIGRhdGEgJT4lDQogIGZpbHRlcihwYXJ0aWNpcGFudC5fY3VycmVudF9wYWdlX25hbWUgPT0gIlBheW1lbnRJbmZvIikgJT4lICMgb25seSBjb21wbGV0ZWQgcGFydGljaXBhbnRzDQogIGZpbHRlcihwYXJ0aWNpcGFudC5sYWJlbCAhPSAiIikgJT4lICMgZXhjbHVkZSBib3RzIChwYXJ0aWNpcGFudHMgY29udHJvbGxlZCBieSBleHBlcmltZW5lciBoYXZlIG5vIGxhYmVsKQ0KICBzZWxlY3QoDQogICAgcGFydGljaXBhbnQubGFiZWwsDQogICAgcGFydGljaXBhbnQucm9sZSwNCiAgICBtYXRjaGVzKCJ1bnBvcFxcLlswLTldK1xcLnBsYXllclxcLmlzX2Ryb3BvdXQiKQ0KICApICU+JQ0KICBwaXZvdF9sb25nZXIoDQogICAgY29scyA9IG1hdGNoZXMoInVucG9wXFwuWzAtOV0rXFwucGxheWVyXFwuaXNfZHJvcG91dCIpLA0KICAgIG5hbWVzX3RvID0gInJvdW5kIiwNCiAgICB2YWx1ZXNfdG8gPSAiaXNfZHJvcG91dCINCiAgKSAlPiUNCiAgbXV0YXRlKA0KICAgIHJvdW5kID0gc3RyX2V4dHJhY3Qocm91bmQsICJbMC05XSsiKSwNCiAgICByb3VuZCA9IGFzLm51bWVyaWMocm91bmQpDQogICkNCg0KDQojIGdldCBmaXJzdCBkcm9wb3V0IHJvdW5kIHBlciBwYXJ0aWNpcGFudA0KZHJvcG91dF9zdW1tYXJ5IDwtIGRyb3BvdXRfbG9uZyAlPiUNCiAgZ3JvdXBfYnkocGFydGljaXBhbnQubGFiZWwsIHBhcnRpY2lwYW50LnJvbGUpICU+JQ0KICBzdW1tYXJpc2UoDQogICAgZXZlbnQgPSBhbnkoaXNfZHJvcG91dCA9PSAxLCBuYS5ybSA9IFRSVUUpLA0KICAgIGRyb3BvdXRfcm91bmQgPSBpZmVsc2UoDQogICAgICBldmVudCwNCiAgICAgIG1pbihyb3VuZFtpc19kcm9wb3V0ID09IDFdLCBuYS5ybSA9IFRSVUUpLA0KICAgICAgMzANCiAgICApLA0KICAgIC5ncm91cHMgPSAiZHJvcCINCiAgKQ0KDQojIGNvdW50IGN1bXVsYXRpdmUgZHJvcG91dHMNCmN1bV9kcm9wb3V0X3JvbGUgPC0gZHJvcG91dF9zdW1tYXJ5ICU+JQ0KICBmaWx0ZXIoZXZlbnQgPT0gVFJVRSkgJT4lDQogIGNvdW50KHBhcnRpY2lwYW50LnJvbGUsIGRyb3BvdXRfcm91bmQpICU+JQ0KICBncm91cF9ieShwYXJ0aWNpcGFudC5yb2xlKSAlPiUNCiAgY29tcGxldGUoZHJvcG91dF9yb3VuZCA9IDE6MzAsIGZpbGwgPSBsaXN0KG4gPSAwKSkgJT4lDQogIGFycmFuZ2UocGFydGljaXBhbnQucm9sZSwgZHJvcG91dF9yb3VuZCkgJT4lDQogIG11dGF0ZSgNCiAgICBjdW11bGF0aXZlX2Ryb3BvdXQgPSBjdW1zdW0obikNCiAgKSAlPiUNCiAgdW5ncm91cCgpDQoNCmdncGxvdChjdW1fZHJvcG91dF9yb2xlLA0KICAgICAgIGFlcyh4ID0gZHJvcG91dF9yb3VuZCwNCiAgICAgICAgICAgeSA9IGN1bXVsYXRpdmVfZHJvcG91dCwNCiAgICAgICAgICAgY29sb3IgPSBwYXJ0aWNpcGFudC5yb2xlKSkgKw0KICBnZW9tX2xpbmUobGluZXdpZHRoID0gMS4yKSArDQogIGdlb21fcG9pbnQoKSArDQogIHNjYWxlX3hfY29udGludW91cyhicmVha3MgPSAxOjMwKSArDQogIHNjYWxlX2NvbG9yX21hbnVhbCgNCiAgICB2YWx1ZXMgPSBjKA0KICAgICAgIlJlZCIgPSAicmVkIiwNCiAgICAgICJCbHVlIiA9ICJibHVlIg0KICAgICkpICsNCiAgbGFicygNCiAgICB4ID0gIlJvdW5kIiwNCiAgICB5ID0gIkRyb3BvdXQiLA0KICAgIGNvbG9yID0gIlJvbGUiLA0KICAgIHRpdGxlID0gIkN1bXVsYXRpdmUgZHJvcG91dCAoYnkgcm9sZSkiDQogICkgKw0KICB0aGVtZV9taW5pbWFsKCkNCmBgYA0KDQotLS0tDQoNCg0KIyMgdW5wb3B1bGFyIG5vcm0gc3ByZWFkDQoNCg0KYGBge3IsY2xhc3Muc291cmNlID0gJ2ZvbGQtaGlkZSd9DQojIGNob2ljZSBiZWhhdmlvciBvdmVyIHJvdW5kczoNCmRmX2xvbmcgPC0gZGF0YSAlPiUNCiAgZmlsdGVyKHBhcnRpY2lwYW50Ll9jdXJyZW50X3BhZ2VfbmFtZSA9PSAiUGF5bWVudEluZm8iKSAlPiUgIyBmaWx0ZXIgYWN0dWFsIHBhcnRpY2lwYW50cw0KICBzZWxlY3QocGFydGljaXBhbnQubGFiZWwsIHBhcnRpY2lwYW50LnJvbGUsIHBhcnRpY2lwYW50Lm5vZGUsIHN0YXJ0c193aXRoKCJ1bnBvcC4iKSkgJT4lICNhbHNvIGluY2x1ZGUgbmV0d29yayBub2RlLg0KICANCiAgcGl2b3RfbG9uZ2VyKA0KICAgIGNvbHMgPSBtYXRjaGVzKCJ1bnBvcFxcLlxcZCtcXC5wbGF5ZXJcXC5jaG9pY2UkIiksICAjIG9ubHkgY2hvaWNlIGNvbHVtbnMNCiAgICBuYW1lc190byA9ICJyb3VuZCIsDQogICAgdmFsdWVzX3RvID0gImNob2ljZSINCiAgKSAlPiUNCiAgDQogIG11dGF0ZSgNCiAgICByb3VuZCA9IGFzLmludGVnZXIoZ3N1YigidW5wb3BcXC4oXFxkKylcXC5wbGF5ZXJcXC5jaG9pY2UiLCAiXFwxIiwgcm91bmQpKSwNCiAgICBpc19ib3QgPSBpZmVsc2UocGFydGljaXBhbnQubGFiZWwgPT0gIiIsIFRSVUUsIEZBTFNFKQ0KICApICU+JQ0KICBzZWxlY3QocGFydGljaXBhbnQubGFiZWwsIHBhcnRpY2lwYW50Lm5vZGUsIHBhcnRpY2lwYW50LnJvbGUsIHJvdW5kLCBjaG9pY2UsIGlzX2JvdCkNCg0KIyBpZGVudGlmeSByb3VuZCBvZiBkcm9wb3V0Og0KZmlyc3RfZHJvcG91dCA8LSBkcm9wb3V0X2xvbmcgJT4lDQogIGZpbHRlcihpc19kcm9wb3V0ID09IDEpICU+JQ0KICBncm91cF9ieShwYXJ0aWNpcGFudC5sYWJlbCkgJT4lDQogIHN1bW1hcmlzZShkcm9wb3V0X3JvdW5kID0gbWluKHJvdW5kKSwNCiAgICAgICAgICAgIC5ncm91cHMgPSAiZHJvcCIpDQoNCiMgYW5kIGFkZCB0byB0aGUgZGY6DQpkZl9sb25nIDwtIGRmX2xvbmcgJT4lDQogIGxlZnRfam9pbihmaXJzdF9kcm9wb3V0LCBieSA9ICJwYXJ0aWNpcGFudC5sYWJlbCIpDQoNCiMgYWdncmVnYXRlZA0KZGZfcGxvdCA8LSBkZl9sb25nICU+JQ0KICBncm91cF9ieShyb3VuZCkgJT4lDQogIHN1bW1hcmlzZSgNCiAgICBwY3RfY2hvaWNlMSA9IG1lYW4oY2hvaWNlLCBuYS5ybSA9IFRSVUUpICogMTAwLCAgIyBwcm9wb3J0aW9uICogMTAwDQogICAgbiA9IG4oKQ0KICApDQoNCmdncGxvdChkZl9wbG90LCBhZXMoeCA9IHJvdW5kLCB5ID0gcGN0X2Nob2ljZTEpKSArDQogIGdlb21fbGluZShncm91cCA9IDEsIGNvbG9yID0gInN0ZWVsYmx1ZSIsIHNpemUgPSAuNSkgKw0KICBnZW9tX3BvaW50KGNvbG9yID0gInN0ZWVsYmx1ZSIsIHNpemUgPSAyKSArDQogICBnZW9tX2hsaW5lKHlpbnRlcmNlcHQgPSAxMCwgbGluZXR5cGUgPSAibG9uZ2Rhc2giLCBjb2xvciA9ICJkYXJrZ3JleSIsIHNpemUgPSAwLjgpICsgICMgZGFzaGVkIGxpbmUgYXQgMTANCiAgc2NhbGVfeF9jb250aW51b3VzKGJyZWFrcyA9IGRmX3Bsb3Qkcm91bmQpICsNCiAgc2NhbGVfeV9jb250aW51b3VzKGxpbWl0cyA9IGMoMCwgMTAwKSkgKyAgDQogIGxhYnMoDQogICAgeCA9ICJSb3VuZCIsDQogICAgeSA9ICIlIGFnZW50cyBjaG9vc2luZyAnYmx1ZSciLA0KICAgIHRpdGxlID0gIkV2b2x1dGlvbiBvZiBhbiB1bnBvcHVsYXIgbm9ybSINCiAgKQ0KDQojc29ydCBieSBub2RlDQpkZl9sb25nIDwtIGRmX2xvbmcgJT4lDQogIGFycmFuZ2UocGFydGljaXBhbnQubm9kZSkgJT4lDQogIHNlbGVjdCgtcGFydGljaXBhbnQubGFiZWwpDQoNCmRmX2xvbmckZHJvcG91dF9yb3VuZFtpcy5uYShkZl9sb25nJGRyb3BvdXRfcm91bmQpXSA8LSAzMCAjbm9uIGRyb3BvdXRzLCBzZXQgdG8gMzAuDQpgYGANCg0KYGBge3IsY2xhc3Muc291cmNlID0gJ2ZvbGQtaGlkZSd9DQojIG1ha2Ugcm9sZXMgY29uc2lzdGVudCB3aXRoIHV0aWxpdHkgZnVuY3Rpb24gcm9sZXMNCmRmX2xvbmckcm9sZSA8LSBpZmVsc2UoZGZfbG9uZyRwYXJ0aWNpcGFudC5yb2xlID09ICJCbHVlIiwgInRyZW5kc2V0dGVyIiwgImNvbmZvcm1pc3QiKQ0KDQojIHNwZWNpZmljeSBpbmNlbnRpdmUgc3RydWN0dXJlIHBhcmFtZXRlcnMNCnBhcmFtcyA9IGxpc3QocyA9IDE1LCBlID0gMTAsIHcgPSA0MCwgeiA9IDUwLCBsYW1iZGExID0gNSwgbGFtYmRhMiA9IDEuOCkNCg0KZGZfbG9uZyRpZCA8LSBkZl9sb25nJHBhcnRpY2lwYW50Lm5vZGUgKyAxICNub2RlcyBhcmUgMC1pbmRleGVkDQoNCiNhZGQgZGVncmVlDQpkZWcgPC0gZGVncmVlKGcpDQpkZl9sb25nIDwtIGRmX2xvbmcgJT4lDQogIG11dGF0ZShkZWdyZWUgPSBkZWdbaWRdKQ0KDQpjYWxjdWxhdGVfcm91bmRfdXRpbGl0aWVzIDwtIGZ1bmN0aW9uKGN1cnJlbnRfcm91bmQsIGRmX2xvbmcsIG5ldHdvcmssIHBhcmFtcykgew0KICAjIHByZXZpb3VzIHJvdW5kIGRhdGENCiAgZGZfcHJldiA8LSBkZl9sb25nICU+JQ0KICAgIGZpbHRlcihyb3VuZCA9PSBjdXJyZW50X3JvdW5kIC0gMSkgJT4lDQogICAgc2VsZWN0KGlkLCByb2xlLCBjaG9pY2UpDQogIA0KICAjIGN1cnJlbnQgcm91bmQgZGF0YQ0KICBkZl9jdXJyIDwtIGRmX2xvbmcgJT4lDQogICAgZmlsdGVyKHJvdW5kID09IGN1cnJlbnRfcm91bmQpDQogIA0KICAjIGNvbXB1dGUgdXRpbGl0aWVzDQogIGRmX2N1cnIgPC0gZGZfY3VyciAlPiUNCiAgICByb3d3aXNlKCkgJT4lDQogICAgbXV0YXRlKA0KICAgICAgdXRpbF8wID0gZnV0aWxpdHkoYWdlbnRfaWQgPSBpZCwgY2hvaWNlID0gMCwNCiAgICAgICAgICAgICAgICAgICAgICAgICBhZ2VudHMgPSBkZl9wcmV2LA0KICAgICAgICAgICAgICAgICAgICAgICAgIG5ldHdvcmsgPSBuZXR3b3JrLA0KICAgICAgICAgICAgICAgICAgICAgICAgIHBhcmFtcyA9IHBhcmFtcykkdXRpbGl0eSwNCiAgICAgIHV0aWxfMSA9IGZ1dGlsaXR5KGFnZW50X2lkID0gaWQsIGNob2ljZSA9IDEsDQogICAgICAgICAgICAgICAgICAgICAgICAgYWdlbnRzID0gZGZfcHJldiwNCiAgICAgICAgICAgICAgICAgICAgICAgICBuZXR3b3JrID0gbmV0d29yaywNCiAgICAgICAgICAgICAgICAgICAgICAgICBwYXJhbXMgPSBwYXJhbXMpJHV0aWxpdHkNCiAgICApICU+JQ0KICAgIHVuZ3JvdXAoKQ0KICANCiAgcmV0dXJuKGRmX2N1cnIpDQp9DQoNCiMjY2FsY3VsYXRlX3JvdW5kX3V0aWxpdGllcygyLCBkZl9sb25nLCBuZXR3b3JrID0gZywgcGFyYW1zID0gcGFyYW1zKQ0KDQojY29tcHV0ZSB1dGlsaXRpZXMgZm9yIGFsbCByb3Vuc2QgKGV4Y2VwdCByb3VuZCAxKQ0KbWF4X3JvdW5kIDwtIG1heChkZl9sb25nJHJvdW5kKQ0KZGYgPC0gbWFwX2RmcigyOm1heF9yb3VuZCwgfmNhbGN1bGF0ZV9yb3VuZF91dGlsaXRpZXMoLngsIGRmX2xvbmcsIGcsIHBhcmFtcykpDQoNCiMgaWRlbnRpZnkgYmVzdCByZXBsaWVzDQpkZiA8LSBkZiAlPiUNCiAgbXV0YXRlKA0KICAgIHByZWRpY3RlZF9jaG9pY2UgPSBpZmVsc2UodXRpbF8xID4gdXRpbF8wLCAxLCAwKSwNCiAgICBiZXN0X3JlcGx5ID0gKGNob2ljZSA9PSBwcmVkaWN0ZWRfY2hvaWNlKSAgIyBUUlVFIGlmIGFnZW50IHBpY2tlZCB0aGUgY2hvaWNlIHdpdGggaGlnaGVzdCB1dGlsaXR5DQogICkNCg0KDQpkZl9zdW1tYXJ5IDwtIGRmICU+JQ0KICBtdXRhdGUoDQogICAgcHJlZmVycmVkX2Nob2ljZSA9IGlmZWxzZShyb2xlID09ICJ0cmVuZHNldHRlciIsIDEsIDApLCAgICAjIGRlZmluZSBwcmVmZXJyZWQgb3B0aW9uIGJ5IHJvbGUNCiAgICBjaG9zZV9wcmVmZXJyZWQgPSAoY2hvaWNlID09IHByZWZlcnJlZF9jaG9pY2UpICAgICAgICAgICAgIyBUUlVFIGlmIHRoZXkgcGlja2VkIHRoZWlyIHByZWZlcnJlZCBvcHRpb24NCiAgKSAlPiUNCiAgZ3JvdXBfYnkocm91bmQsIHJvbGUpICU+JQ0KICBzdW1tYXJpemUoDQogICAgbl9hZ2VudHMgPSBuKCksDQogICAgcHJvcF9wcmVmZXJyZWQgPSBtZWFuKGNob3NlX3ByZWZlcnJlZCksICAgIyBmcmFjdGlvbiB0aGF0IGNob3NlIHRoZWlyIHByZWZlcnJlZCBvcHRpb24NCiAgICBwcm9wX2Jlc3RfcmVwbHkgPSBtZWFuKGJlc3RfcmVwbHkpLCAgICAgICAjIGZyYWN0aW9uIHRoYXQgcGlja2VkIHRoZSBoaWdoZXN0LXV0aWxpdHkgY2hvaWNlDQogICAgLmdyb3VwcyA9ICJkcm9wIg0KICApDQoNCg0KZ2dwbG90KGRmX3N1bW1hcnksIGFlcyh4ID0gcm91bmQpKSArDQogIGdlb21fbGluZShhZXMoeSA9IHByb3BfcHJlZmVycmVkLCBjb2xvciA9ICJQcmVmZXJlbmNlIiksIHNpemUgPSAxKSArDQogIGdlb21fbGluZShhZXMoeSA9IHByb3BfYmVzdF9yZXBseSwgY29sb3IgPSAiQmVzdCByZXBseSIpLCBzaXplID0gMSwgbGluZXR5cGUgPSAiZGFzaGVkIikgKw0KICBmYWNldF93cmFwKH5yb2xlKSArDQogIHNjYWxlX3lfY29udGludW91cyhsYWJlbHMgPSBzY2FsZXM6OnBlcmNlbnRfZm9ybWF0KGFjY3VyYWN5ID0gMSksIGxpbWl0cyA9IGMoMCwxKSkgKw0KICBzY2FsZV9jb2xvcl9tYW51YWwodmFsdWVzID0gYygiUHJlZmVyZW5jZSIgPSAiZGFya2dyZWVuIiwgIkJlc3QgcmVwbHkiID0gInN0ZWVsYmx1ZSIpKSArDQogIGxhYnMoDQogICAgeCA9ICJSb3VuZCIsDQogICAgeSA9ICJQcm9wb3J0aW9uIG9mIGFnZW50cyIsDQogICAgY29sb3IgPSAiTWV0cmljIiwNCiAgICB0aXRsZSA9ICJGb2xsb3dpbmcgcHJlZmVyZW5jZSB2cyBiZXN0LXJlcGx5IG92ZXIgcm91bmRzIg0KICApDQoNCmBgYCANCg0K
Copyright © Rob Franken