Experiment
Last compiled on 23-03-2026
1 Getting started
To copy the code, click the button in the upper right corner of the code-chunks.
1.1 clean up
rm(list = ls())
gc()
1.2 custom functions
We defined a number custom functions, at Download custom_functions.R.
source("./custom_functions.R")1.3 necessary packages
tidyverse: data wranglingigraph: generate and visualize graphsparallel: parallel computing to speed up simulationforeach: looping in paralleldoParallel: parallel backend forforeachggplot2: data visualizationggh4x: hacks forggplot2ggpubr: make visualizations publication-ready
packages = c("tidyverse", "igraph", "ggplot2", "parallel", "doParallel", "foreach", "ggh4x", "ggpubr",
    "plotly", "RColorBrewer", "grid", "gridExtra", "patchwork", "ggplotify", "ggraph", "gganimate", "RColorBrewer",
    "ggtext", "magick", "jsonlite", "lubridate", "ggtext")

invisible(fpackage.check(packages))
rm(packages)
2 import data
data <- read.csv("./rawdata/all_apps_wide_2026-03-06.csv")
times <- read.csv("./rawdata/PageTimes-2026-03-06.csv")

# cbind(data$participant.node,data$participant.role)[complete.cases(
# #cbind(data$participant.node,data$participant.role)),]

bonus <- data[, c("participant.bonus", "participant.label")]
bonus <- bonus[!is.na(bonus$participant.bonus), ]
bonus_out <- data.frame(id = bonus$participant.label, bonus = bonus$participant.bonus)
nrow(bonus_out)
#> [1] 40write.table(bonus_out, "bonus.txt", sep = ",", row.names = FALSE, col.names = TRUE, quote = FALSE)3 results
On 06-03-2026, I recruited 58 Prolific participants via a brief sign-up survey to populate a network of N=50 (with a 10% minority group).
net <- jsonlite::fromJSON("./networks/network_test_n50.json")

g <- graph_from_adjacency_matrix(net$adj_matrix, mode = "undirected")
V(g)$role <- ifelse(net$role_vector == 1, "trendsetter", "conformist")

fplot_graph(g)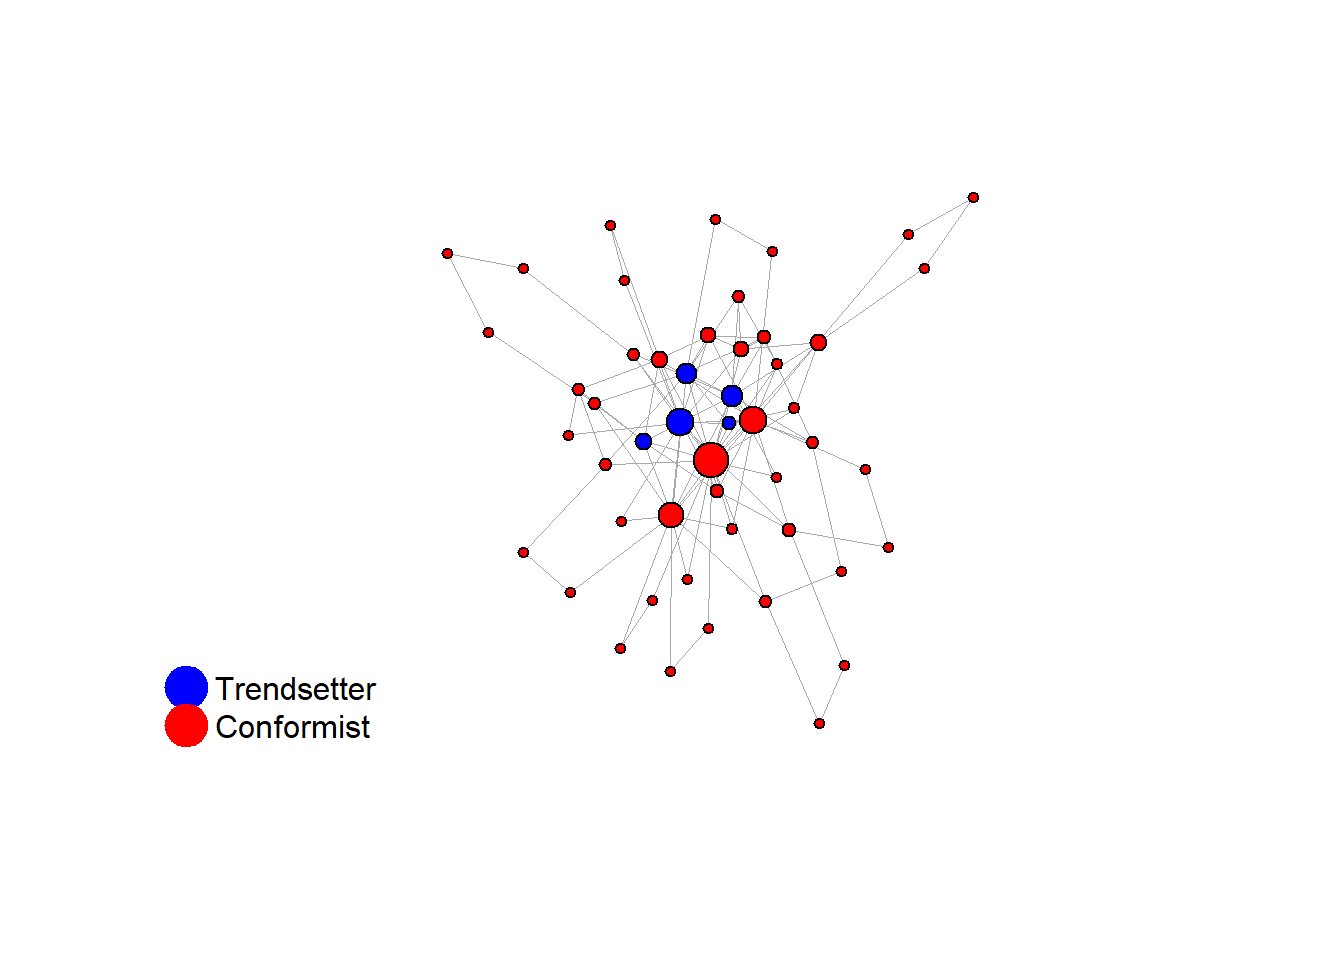
3.1 diagnostics
3.1.1 dropout
dropout_long <- data %>%
    filter(!is.na(participant.node)) %>%
    select(participant.label, participant.role, matches("unpop\\.[0-9]+\\.player\\.is_dropout")) %>%
    pivot_longer(cols = matches("unpop\\.[0-9]+\\.player\\.is_dropout"), names_to = "round", values_to = "is_dropout") %>%
    mutate(round = str_extract(round, "[0-9]+"), round = as.numeric(round))

dropout_df <- data.frame(player = 1:nrow(data), dropout_round = apply(do.call(cbind, data[paste0("unpop.",
    1:25, ".player.is_dropout")]), 1, function(x) which(x == 1)[1]))
ggplot(na.omit(dropout_df), aes(x = dropout_round)) + geom_bar()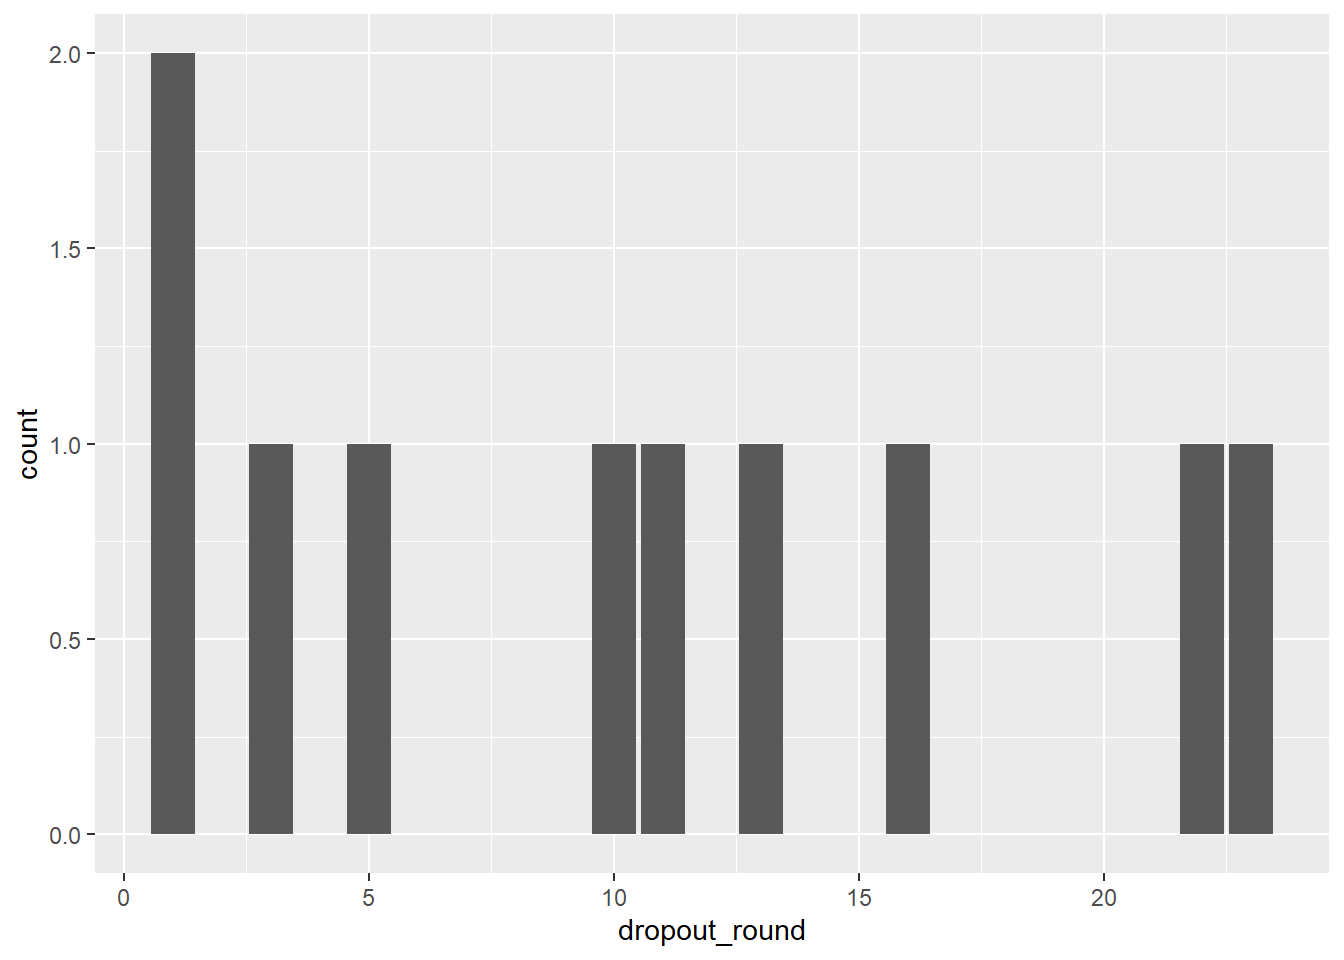
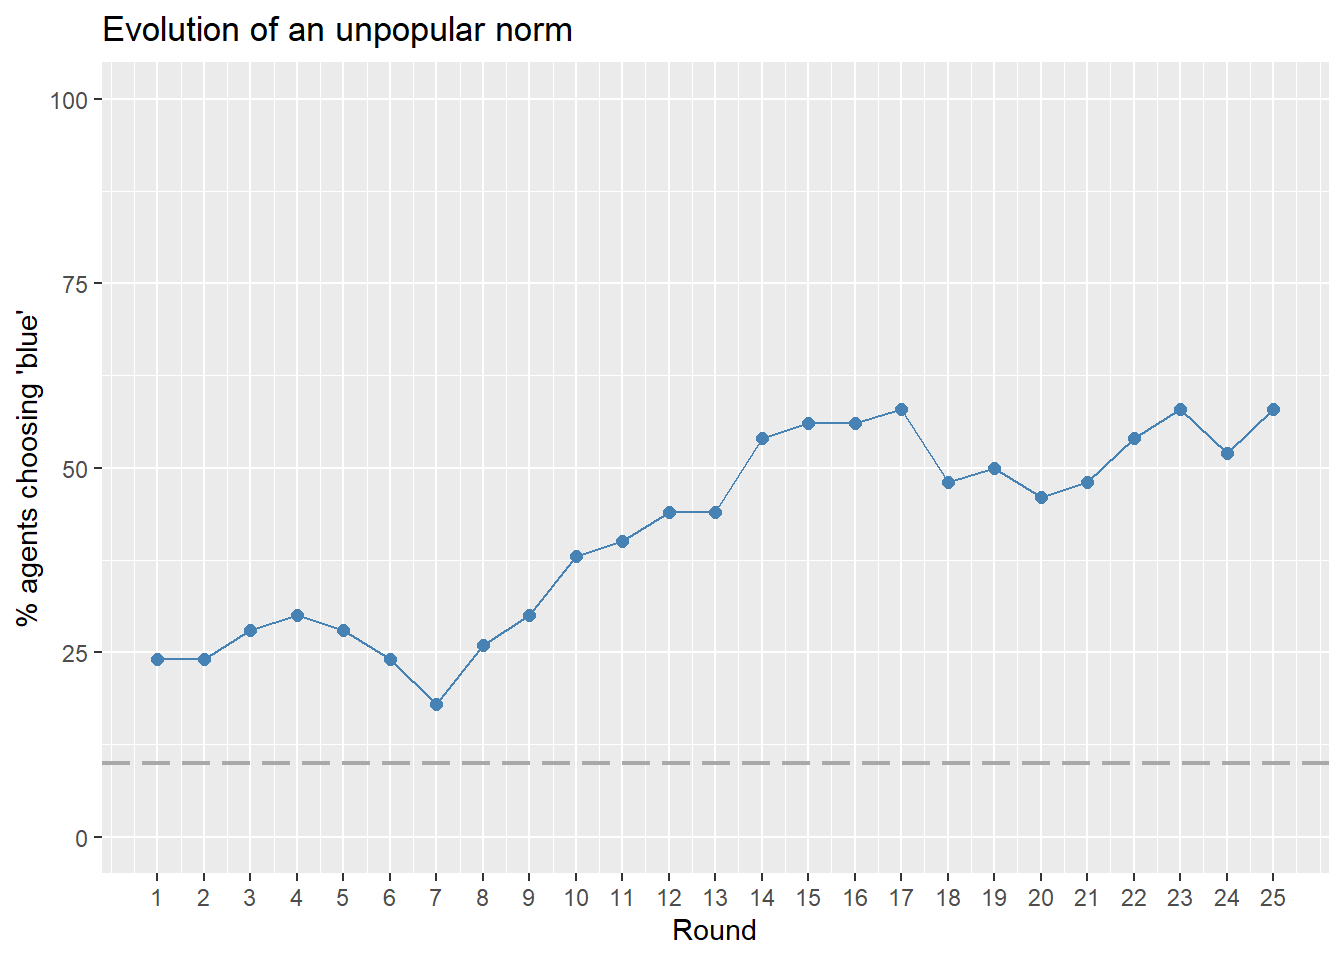
3.2 unpopular norm spread
df_long <- data %>%
  filter(!is.na(participant.node)) %>%
  select(participant.label, participant.role, participant.node, starts_with("unpop.")) %>% #also include network node.

  pivot_longer(
    cols = matches("unpop\\.\\d+\\.player\\.choice$"),  # only choice columns
    names_to = "round",
    values_to = "choice"
  ) %>%
  mutate(
    round = as.integer(gsub("unpop\\.(\\d+)\\.player\\.choice", "\\1", round)),
    is_bot = ifelse(participant.label == "", TRUE, FALSE)
  ) %>%
  select(participant.label, participant.node, participant.role, round, choice, is_bot)


# identify round of dropout:
first_dropout <- dropout_long %>%
  filter(is_dropout == 1) %>%
  group_by(participant.label) %>%
  summarise(dropout_round = min(round),
            .groups = "drop")

# and add to the df:
df_long <- df_long %>%
  left_join(first_dropout, by = "participant.label")

# aggregated
df_plot <- df_long %>%
  group_by(round) %>%
  summarise(
    pct_choice1 = mean(choice, na.rm = TRUE) * 100,  # proportion * 100
    n = n()
  )

ggplot(df_plot, aes(x = round, y = pct_choice1)) +
  geom_line(group = 1, color = "steelblue", size = .5) +
  geom_point(color = "steelblue", size = 2) +
   geom_hline(yintercept = 10, linetype = "longdash", color = "darkgrey", size = 0.8) +  # dashed line at 10
  scale_x_continuous(breaks = df_plot$round) +
  scale_y_continuous(limits = c(0, 100)) +
  labs(
    x = "Round",
    y = "% agents choosing 'blue'",
    title = "Evolution of an unpopular norm"
  )
#sort by node
df_long <- df_long %>%
  arrange(participant.node) %>%
  select(-participant.label)

df_long$dropout_round[is.na(df_long$dropout_round)] <- 25 #non dropouts, set to 25.
# make roles consistent with utility function roles
df_long$role <- ifelse(df_long$participant.role == "Blue", "trendsetter", "conformist")
# specificy incentive structure parameters
params = list(s = 15, e = 10, w = 40, z = 50, lambda1 = 5, lambda2 = 1.8)
df_long$id <- df_long$participant.node + 1 #nodes are 0-indexed
#add degree
deg <- degree(g)
df_long <- df_long %>%
mutate(degree = deg[id])
calculate_round_utilities <- function(current_round, df_long, network, params) {
# previous round data
df_prev <- df_long %>%
filter(round == current_round - 1) %>%
select(id, role, choice)
# current round data
df_curr <- df_long %>%
filter(round == current_round)
# compute utilities
df_curr <- df_curr %>%
rowwise() %>%
mutate(
util_0 = futility(agent_id = id, choice = 0,
agents = df_prev,
network = network,
params = params)$utility,
util_1 = futility(agent_id = id, choice = 1,
agents = df_prev,
network = network,
params = params)$utility
) %>%
ungroup()
return(df_curr)
}
##calculate_round_utilities(2, df_long, network = g, params = params)
#compute utilities for all rounsd (except round 1)
max_round <- max(df_long$round)
df <- map_dfr(2:max_round, ~calculate_round_utilities(.x, df_long, g, params))
# identify best replies
df <- df %>%
mutate(
predicted_choice = ifelse(util_1 > util_0, 1, 0),
best_reply = (choice == predicted_choice) # TRUE if agent picked the choice with highest utility
)
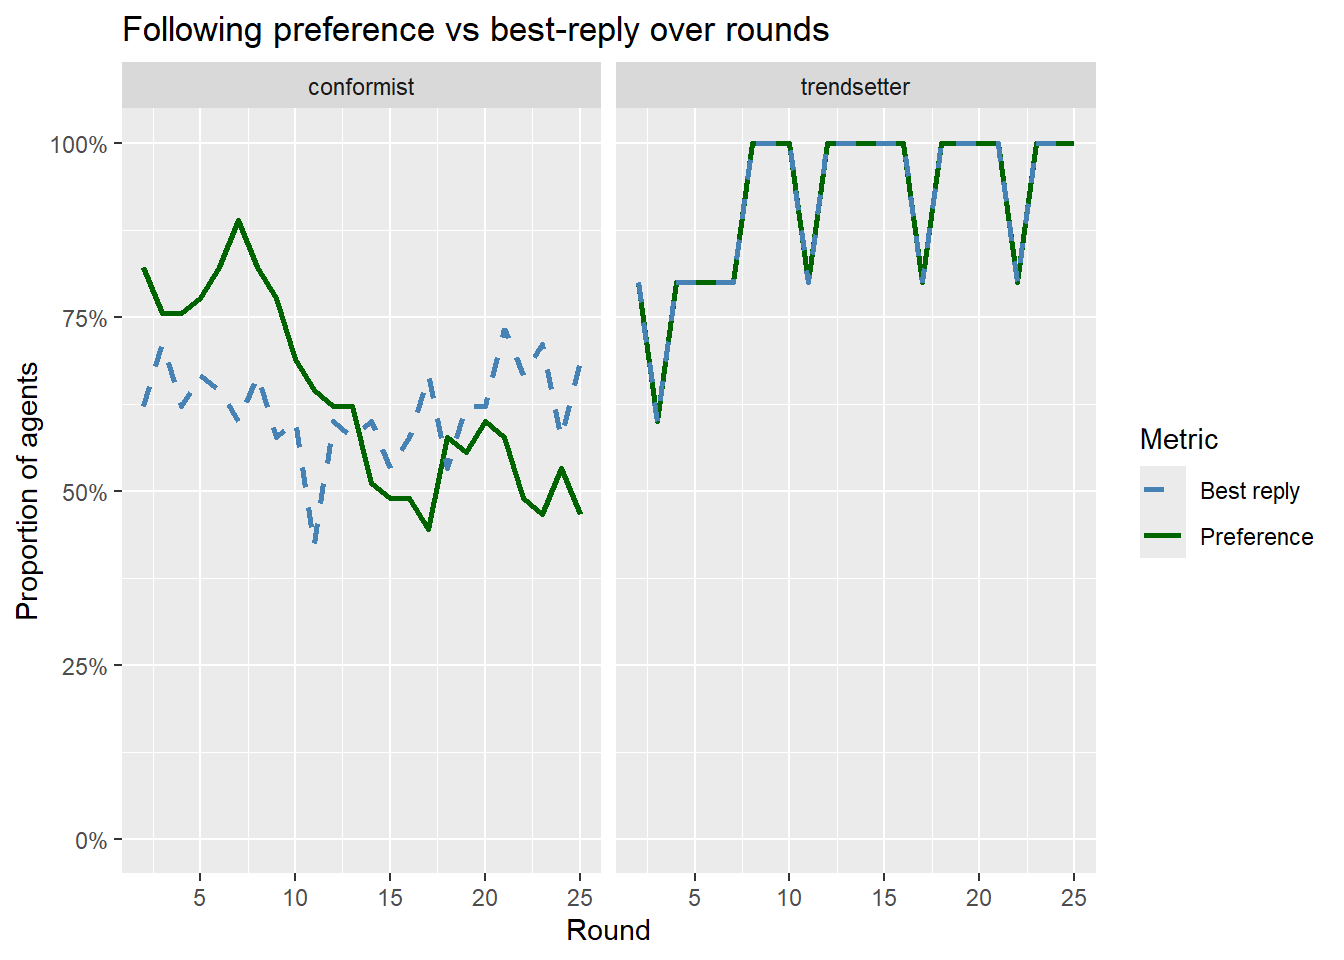
df_summary <- df %>%
mutate(
preferred_choice = ifelse(role == "trendsetter", 1, 0), # define preferred option by role
chose_preferred = (choice == preferred_choice) # TRUE if they picked their preferred option
) %>%
group_by(round, role) %>%
summarize(
n_agents = n(),
prop_preferred = mean(chose_preferred), # fraction that chose their preferred option
prop_best_reply = mean(best_reply), # fraction that picked the highest-utility choice
.groups = "drop"
)
ggplot(df_summary, aes(x = round)) +
geom_line(aes(y = prop_preferred, color = "Preference"), size = 1) +
geom_line(aes(y = prop_best_reply, color = "Best reply"), size = 1, linetype = "dashed") +
facet_wrap(~role) +
scale_y_continuous(labels = scales::percent_format(accuracy = 1), limits = c(0,1)) +
scale_color_manual(values = c("Preference" = "darkgreen", "Best reply" = "steelblue")) +
labs(
x = "Round",
y = "Proportion of agents",
color = "Metric",
title = "Following preference vs best-reply over rounds"
)
table(data$survey.1.player.enjoyment)#>
#> 1 3 4 5
#> 1 4 15 19table(data$survey.1.player.clarity)#>
#> 4 5
#> 16 23table(data$survey.1.player.majority)#>
#> 1 2
#> 20 19fshowdf(unique(data$survey.1.player.strategy))| x |
|---|
| i tried to go with the flow with my neighbors |
| i tried to connect with the neighbours, so we can match more often, then i started picking red for the point increase |
| I tried to follow a pattern based on what my neighbors answered. |
| I expected everyone to choose Red since Red = assured number of points, and it’s the color that guarantees a maximum gain. For some reason not everyone did choose red, unless I missed a point where some people need the blue shirt for those initial 15 points. I kept choosing red until it became clear that blue was dominant and by dominant I mean 5/6 of my neighbors did choose it for some reason. a 4/6 they should have been having 39 points (only 2 points higher than me). So once I started choosing blue I kept it that way. I assumed that I have been grouped with different people who prioritized blue. |
| Since red team members were more, i used the ratio of 4:1 in deciding what to choose |
| Keeping in the color with the better recompense, changing to another when the occasion seems to promise better benefits |
| Didnt used any strategy but just some good guesses |
| I did not have a strategy |
| I would always try and look for how to gain more points by assessing which shirt was picked by most people the last round. |
| I choose the color if I see more than 3 people choosing that color |
| I always chose red because I knew it was the only option that guaranteed I’d benefit in each round. |
| I decided on the bases of the other members choices, if they choosing majorly red then i choose red but if they choose blue then i also choose blue according to the majority of the members decision |
| I saw in each round how many more shirts there were and in the next round I chose that one. |
| I used color which was chosen by more players in the previous rounds |
| I checked the one with higher points, judging from previous accumulated points |
| I followed what my neighbours seemed to choose keeping in mind which option benefits me more and is aligned to their choices. |
| Based on the previous neighbours wearings |
| I decided to wear the color that most people wore the day before hoping that I would get more points that way. |
| Firstly I was trying to convince them for the red to get the most points. but the were insisting on blue so I decided to go with flow for earning much points. from time to time I give a red one to convince them back for the red but I failed. |
| At first I was going to choose depending on what my neighbors did, but after picking blue one time and getting 0 points, I realised that picking red every time will just be a more sound strategy as there is no way to lose completely. I continued to pick red every single time until approximately halfway into the experiment my neighbors started picking blue every single time, at which point after two or three rounds I had to conform to the rest of the group because it seemed like they weren’t going to conform to me. |
| I tried to fit in with the rest of the team to get bonus |
| I was checking which T-shirt my neighbors chose most of the time. |
| I tried to predict my neighbors colors and choose the color that I tought the majority was choosing |
| One that would maximise my bonus by choosing red almost all the time. |
| non just chose the one felt good for that day |
| In the first rounds, I tried the blue because we can have more points and after that I always choose de blue. I see that the red neigbours does’nt at all . In the middle I changed to the red to insit the red one to bascule to the blue but it changed nothing and after I always choose the blue side. |
| That I should check my neighbors previous decisions, so I decide on which T-shirt to choose for the next day. |
| I used the instructions I was given |
| I went with the one that would give the most points every singke time |
| I prioritized coordinatio. I switch to blue when 2 or more neighbors chose it beacuse the payoff was higher than staying with red. |
| I chose depending on the color my neighbors and the majority chose |
| I noticed that my neighbours liked a certain colour, so I stuck with that colour |
| I always selected my colour because I was gurenteed points |
| Weighing my options before deciding on the perfect color was a crucial part of the game, but once my team stuck to one color, everything went perfect. The strategy i used was to pick a colour that has a fixed point, but it later changed. |
| At first i choose red bcz it seems we got a stable base points. But then we have to check the trend of our neighbors. Blue seems to get more points and Red at the same number of neighbors. So if it is equal in number, we need to switch to blue right away |
fshowdf(unique(data$survey.1.player.perceived_rq))| x |
|---|
| it was about influence of other people at my choice |
| perhaps the decision making given the fact that, the preferred t shirt color gave always some points |
| I think i was a logic and coorditation game, like a behavior study. |
| At what point is the person ready to gamble and risk his safety line of 15 points? Maybe Or maybe it’s at what point does the person start following the masses. |
| To check decision making in the context of synchronization with team members |
| Influence of behaviors within communities |
| Trying to see how the majority of the votes affect the choice of each player. |
| Maybe they were trying to understand people’s working of mind? like where does they lean to gurantee little points? or risked but bigger rewardss |
| they are trying to see what people will often side with |
| I think it is judge how people influence each other when it comes to decision making. |
| I think the researchers wanted to study whether a person’s psychology and decision-making are based on the changes in those around them. |
| Study about herd mentality |
| I think this study was examining how people’s decisions are influenced by assumptions of others’ actions. |
| The experiment was based on the decision making in the pressure situation. How we react in a pressure situation. |
| What majority chooses red and what majority chooses blue? |
| Strategic thinking |
| The study was about the fashion dilemma |
| How our neighbours’ choice affects ours and to what extent. |
| The experiment is studying how people make decisions in social networks when coordination matters. |
| I think that the experiment is about how people are pressured into choosing something based on what other people choose. |
| I think the idea was to try to see how easily others are influenced by the majority and willing to fit in. |
| Psychology of the affection with people choices and how long would you consist on your opinion if different. The money was added to attract you more toward following the majority and matching with neighbors. I guess also my neighbors were AI bots to make the study on me |
| This experiment was definitely about peer pressure and conforming to expectations. With something on the line (a bonus payment) I am more likely to change my strategy if what I’ve been doing until then isn’t working. |
| this was test decision making within the group |
| to see if people could take risks |
| About team work and critical thinking |
| I think this experiment is about psychology + behavioral economics and social influence |
| If individuals follow the crowd or not |
| seeing the decising people make or the decision people chose |
| I think it is about groups psychological behaviours. The researcher try to find the degree of mutual help within a group. |
| The experiment was about finding out what the majority is going to choose based on the colors and the decisions of the others. |
| Memory and speed |
| Whether people can change their choices (even though they provide the best outcome) based on the actions of others. |
| Social coordination and how individual preferences change to match the group’s behaviour for higher rewards. |
| I think the researcher is trying to answer the question of how players in group setting maximize profits by predicting the trend or other players’ mind |
| Red was preferred more than blue |
| Seeing people’s decsion making skills based on external influence |
| I think the researcher is trying to discover decision-making in a group of people, and what factors influence those decisions. |
| To test the mentality in group behaviours |
fshowdf(unique(data$survey.1.player.comments))| x |
|---|
| no, thank you |
| nothing else to add. |
| None |
| Can I see which color will be the dominant one in the whole game after finishing? |
| I enjoyed it very much. |
| I want more!!! |
| I would like to participate in similar tasks again. |
| Thank you for the fun experiment and the game in the waiting room! |
| I had fun with this experiment. |
| I would like to receive the explanation of the study and share in any future similar studies |
| I liked that there was a minigame! |
| no |
| No, this experiment is clear and interesting |
| n/a |
| enjoyed the game |
| I enjoyed the experiment, thank you. |
| N/A |
| Everything was clear and the interface was easy to use. I would like to participate in a similar experiment. |
| Thank you, this was fun |
| I like this study and theme. wish u all the best |
# completion_code:CI5BFLABLS0tDQp0aXRsZTogIkV4cGVyaW1lbnQiDQpiaWJsaW9ncmFwaHk6IHJlZmVyZW5jZXMuYmliDQpsaW5rLWNpdGF0aW9uczogdHJ1ZQ0KZGF0ZTogIkxhc3QgY29tcGlsZWQgb24gYHIgZm9ybWF0KFN5cy50aW1lKCksICclZC0lbS0lWScpYCINCm91dHB1dDogDQogIGh0bWxfZG9jdW1lbnQ6DQogICAgc2VsZl9jb250YWluZWQ6IHRydWUNCiAgICBjc3M6IHR3ZWFrcy5jc3MNCiAgICB0b2M6IHRydWUNCiAgICB0b2NfZmxvYXQ6IHRydWUNCiAgICBudW1iZXJfc2VjdGlvbnM6IHRydWUNCiAgICB0b2NfZGVwdGg6IDQNCiAgICBjb2RlX2ZvbGRpbmc6IHNob3cNCiAgICBjb2RlX2Rvd25sb2FkOiB5ZXMNCi0tLQ0KDQpgYGB7ciwgZ2xvYmFsc2V0dGluZ3MsIGVjaG89RkFMU0UsIHdhcm5pbmc9RkFMU0UsIHJlc3VsdHM9J2hpZGUnLCBtZXNzYWdlPUZBTFNFfQ0KbGlicmFyeShrbml0cikNCmxpYnJhcnkodGlkeXZlcnNlKQ0Ka25pdHI6Om9wdHNfY2h1bmskc2V0KGVjaG8gPSBUUlVFKQ0Kb3B0c19jaHVuayRzZXQodGlkeS5vcHRzPWxpc3Qod2lkdGguY3V0b2ZmPTEwMCksdGlkeT1UUlVFLCB3YXJuaW5nID0gRkFMU0UsIG1lc3NhZ2UgPSBGQUxTRSxjb21tZW50ID0gIiM+IiwgY2FjaGU9VFJVRSwgY2xhc3Muc291cmNlPWMoInRlc3QiKSwgY2xhc3Mub3V0cHV0PWMoInRlc3QzIikpDQpvcHRpb25zKHdpZHRoID0gMTAwKQ0KcmdsOjpzZXR1cEtuaXRyKCkNCg0KY29sb3JpemUgPC0gZnVuY3Rpb24oeCwgY29sb3IpIHtzcHJpbnRmKCI8c3BhbiBzdHlsZT0nY29sb3I6ICVzOyc+JXM8L3NwYW4+IiwgY29sb3IsIHgpIH0NCmBgYA0KDQpgYGB7ciBrbGlwcHksIGVjaG89RkFMU0UsIGluY2x1ZGU9VFJVRX0NCmtsaXBweTo6a2xpcHB5KHBvc2l0aW9uID0gYygndG9wJywgJ3JpZ2h0JykpDQoja2xpcHB5OjprbGlwcHkoY29sb3IgPSAnZGFya3JlZCcpDQoja2xpcHB5OjprbGlwcHkodG9vbHRpcF9tZXNzYWdlID0gJ0NsaWNrIHRvIGNvcHknLCB0b29sdGlwX3N1Y2Nlc3MgPSAnRG9uZScpDQpgYGANCg0KLS0tDQoNCiMgR2V0dGluZyBzdGFydGVkDQoNClRvIGNvcHkgdGhlIGNvZGUsIGNsaWNrIHRoZSBidXR0b24gaW4gdGhlIHVwcGVyIHJpZ2h0IGNvcm5lciBvZiB0aGUgY29kZS1jaHVua3MuDQoNCiMjIGNsZWFuIHVwDQoNCmBgYHtyLCBjbGVhbl91cCwgcmVzdWx0cz0naGlkZSd9DQpybShsaXN0PWxzKCkpDQpnYygpDQpgYGANCg0KPGJyPg0KDQojIyBjdXN0b20gZnVuY3Rpb25zDQoNCldlIGRlZmluZWQgYSBudW1iZXIgY3VzdG9tIGZ1bmN0aW9ucywgYXQgYHIgeGZ1bjo6ZW1iZWRfZmlsZSgiLi9jdXN0b21fZnVuY3Rpb25zLlIiKWAuDQoNCmBgYHtyLCBjdXN0b21fZnVuY3Rpb25zfQ0Kc291cmNlKCIuL2N1c3RvbV9mdW5jdGlvbnMuUiIpDQpgYGANCg0KPGJyPg0KDQojIyBuZWNlc3NhcnkgcGFja2FnZXMNCg0KLSBgdGlkeXZlcnNlYDogZGF0YSB3cmFuZ2xpbmcNCi0gYGlncmFwaGA6IGdlbmVyYXRlIGFuZCB2aXN1YWxpemUgZ3JhcGhzDQotIGBwYXJhbGxlbGA6IHBhcmFsbGVsIGNvbXB1dGluZyB0byBzcGVlZCB1cCBzaW11bGF0aW9uDQotIGBmb3JlYWNoYDogbG9vcGluZyBpbiBwYXJhbGxlbA0KLSBgZG9QYXJhbGxlbGA6IHBhcmFsbGVsIGJhY2tlbmQgZm9yIGBmb3JlYWNoYA0KLSBgZ2dwbG90MmA6IGRhdGEgdmlzdWFsaXphdGlvbg0KLSBgZ2doNHhgOiBoYWNrcyBmb3IgYGdncGxvdDJgDQotIGBnZ3B1YnJgOiBtYWtlIHZpc3VhbGl6YXRpb25zIHB1YmxpY2F0aW9uLXJlYWR5DQoNCg0KYGBge3IsIHBhY2thZ2VzfQ0KcGFja2FnZXMgPSBjKCJ0aWR5dmVyc2UiLCAiaWdyYXBoIiwgImdncGxvdDIiLCAicGFyYWxsZWwiLCAiZG9QYXJhbGxlbCIsICJmb3JlYWNoIiwgImdnaDR4IiwgImdncHViciIsICJwbG90bHkiLCAiUkNvbG9yQnJld2VyIiwgImdyaWQiLCAiZ3JpZEV4dHJhIiwgInBhdGNod29yayIsICJnZ3Bsb3RpZnkiLCAiZ2dyYXBoIiwgImdnYW5pbWF0ZSIsICJSQ29sb3JCcmV3ZXIiLA0KICAgICJnZ3RleHQiLCAibWFnaWNrIiwgImpzb25saXRlIiwgImx1YnJpZGF0ZSIsICJnZ3RleHQiKQ0KDQppbnZpc2libGUoZnBhY2thZ2UuY2hlY2socGFja2FnZXMpKQ0Kcm0ocGFja2FnZXMpDQpgYGANCg0KLS0tDQoNCiMgaW1wb3J0IGRhdGENCg0KYGBge3J9DQpkYXRhIDwtIHJlYWQuY3N2KCIuL3Jhd2RhdGEvYWxsX2FwcHNfd2lkZV8yMDI2LTAzLTA2LmNzdiIpDQp0aW1lcyA8LSByZWFkLmNzdigiLi9yYXdkYXRhL1BhZ2VUaW1lcy0yMDI2LTAzLTA2LmNzdiIpDQoNCiNjYmluZChkYXRhJHBhcnRpY2lwYW50Lm5vZGUsZGF0YSRwYXJ0aWNpcGFudC5yb2xlKVtjb21wbGV0ZS5jYXNlcyggI2NiaW5kKGRhdGEkcGFydGljaXBhbnQubm9kZSxkYXRhJHBhcnRpY2lwYW50LnJvbGUpKSxdDQoNCmJvbnVzIDwtIGRhdGFbLCBjKCJwYXJ0aWNpcGFudC5ib251cyIsICJwYXJ0aWNpcGFudC5sYWJlbCIpXQ0KYm9udXMgPC0gYm9udXNbIWlzLm5hKGJvbnVzJHBhcnRpY2lwYW50LmJvbnVzKSwgXQ0KYm9udXNfb3V0IDwtIGRhdGEuZnJhbWUoDQogIGlkID0gYm9udXMkcGFydGljaXBhbnQubGFiZWwsDQogIGJvbnVzID0gYm9udXMkcGFydGljaXBhbnQuYm9udXMNCikNCm5yb3coYm9udXNfb3V0KQ0Kd3JpdGUudGFibGUoYm9udXNfb3V0LCAiYm9udXMudHh0Iiwgc2VwID0gIiwiLCByb3cubmFtZXMgPSBGQUxTRSwgY29sLm5hbWVzID0gVFJVRSwgcXVvdGUgPSBGQUxTRSkNCmBgYA0KDQotLS0NCg0KIyByZXN1bHRzDQoNCk9uIDA2LTAzLTIwMjYsIEkgcmVjcnVpdGVkIDU4IFByb2xpZmljIHBhcnRpY2lwYW50cyB2aWEgYSBicmllZiBbc2lnbi11cCBzdXJ2ZXldKGh0dHBzOi8vZ2l0aHViLmNvbS9VdHJlY2h0VW5pdmVyc2l0eS9zaWduLXVwLWV4cGVyaW1lbnQpIHRvIHBvcHVsYXRlIGEgbmV0d29yayBvZiBOPTUwICh3aXRoIGEgMTAlIG1pbm9yaXR5IGdyb3VwKS4NCg0KYGBge3IsIGNsYXNzLnNvdXJjZSA9ICdmb2xkLWhpZGUnfQ0KbmV0IDwtIGpzb25saXRlOjpmcm9tSlNPTigiLi9uZXR3b3Jrcy9uZXR3b3JrX3Rlc3RfbjUwLmpzb24iKQ0KDQpnIDwtIGdyYXBoX2Zyb21fYWRqYWNlbmN5X21hdHJpeChuZXQkYWRqX21hdHJpeCwgbW9kZSA9ICJ1bmRpcmVjdGVkIikNClYoZykkcm9sZSA8LSBpZmVsc2UobmV0JHJvbGVfdmVjdG9yID09IDEsICJ0cmVuZHNldHRlciIsICJjb25mb3JtaXN0IikNCg0KZnBsb3RfZ3JhcGgoZyApDQpgYGANCg0KDQo8YnI+DQoNCiMjIGRpYWdub3N0aWNzDQoNCg0KIyMjIGRyb3BvdXQNCg0KDQpgYGB7ciwgY2xhc3Muc291cmNlID0gJ2ZvbGQtaGlkZSd9DQpkcm9wb3V0X2xvbmcgPC0gZGF0YSAlPiUNCiAgZmlsdGVyKCFpcy5uYShwYXJ0aWNpcGFudC5ub2RlKSkgJT4lDQogIHNlbGVjdCgNCiAgICBwYXJ0aWNpcGFudC5sYWJlbCwNCiAgICBwYXJ0aWNpcGFudC5yb2xlLA0KICAgIG1hdGNoZXMoInVucG9wXFwuWzAtOV0rXFwucGxheWVyXFwuaXNfZHJvcG91dCIpDQogICkgJT4lDQogIHBpdm90X2xvbmdlcigNCiAgICBjb2xzID0gbWF0Y2hlcygidW5wb3BcXC5bMC05XStcXC5wbGF5ZXJcXC5pc19kcm9wb3V0IiksDQogICAgbmFtZXNfdG8gPSAicm91bmQiLA0KICAgIHZhbHVlc190byA9ICJpc19kcm9wb3V0Ig0KICApICU+JQ0KICBtdXRhdGUoDQogICAgcm91bmQgPSBzdHJfZXh0cmFjdChyb3VuZCwgIlswLTldKyIpLA0KICAgIHJvdW5kID0gYXMubnVtZXJpYyhyb3VuZCkNCiAgKQ0KDQpkcm9wb3V0X2RmIDwtIGRhdGEuZnJhbWUoDQogIHBsYXllciA9IDE6bnJvdyhkYXRhKSwNCiAgZHJvcG91dF9yb3VuZCA9IGFwcGx5KA0KICAgIGRvLmNhbGwoY2JpbmQsIGRhdGFbcGFzdGUwKCJ1bnBvcC4iLDE6MjUsIi5wbGF5ZXIuaXNfZHJvcG91dCIpXSksDQogICAgMSwNCiAgICBmdW5jdGlvbih4KSB3aGljaCh4ID09IDEpWzFdDQogICkNCikNCmdncGxvdChuYS5vbWl0KGRyb3BvdXRfZGYpLCBhZXMoeCA9IGRyb3BvdXRfcm91bmQpKSArDQogIGdlb21fYmFyKCkNCmBgYA0KDQoNCg0KLS0tLQ0KDQoNCiMjIHVucG9wdWxhciBub3JtIHNwcmVhZA0KDQpgYGB7cixjbGFzcy5zb3VyY2UgPSAnZm9sZC1oaWRlJ30NCmRmX2xvbmcgPC0gZGF0YSAlPiUNCiAgZmlsdGVyKCFpcy5uYShwYXJ0aWNpcGFudC5ub2RlKSkgJT4lDQogIHNlbGVjdChwYXJ0aWNpcGFudC5sYWJlbCwgcGFydGljaXBhbnQucm9sZSwgcGFydGljaXBhbnQubm9kZSwgc3RhcnRzX3dpdGgoInVucG9wLiIpKSAlPiUgI2Fsc28gaW5jbHVkZSBuZXR3b3JrIG5vZGUuDQogIA0KICBwaXZvdF9sb25nZXIoDQogICAgY29scyA9IG1hdGNoZXMoInVucG9wXFwuXFxkK1xcLnBsYXllclxcLmNob2ljZSQiKSwgICMgb25seSBjaG9pY2UgY29sdW1ucw0KICAgIG5hbWVzX3RvID0gInJvdW5kIiwNCiAgICB2YWx1ZXNfdG8gPSAiY2hvaWNlIg0KICApICU+JQ0KICBtdXRhdGUoDQogICAgcm91bmQgPSBhcy5pbnRlZ2VyKGdzdWIoInVucG9wXFwuKFxcZCspXFwucGxheWVyXFwuY2hvaWNlIiwgIlxcMSIsIHJvdW5kKSksDQogICAgaXNfYm90ID0gaWZlbHNlKHBhcnRpY2lwYW50LmxhYmVsID09ICIiLCBUUlVFLCBGQUxTRSkNCiAgKSAlPiUNCiAgc2VsZWN0KHBhcnRpY2lwYW50LmxhYmVsLCBwYXJ0aWNpcGFudC5ub2RlLCBwYXJ0aWNpcGFudC5yb2xlLCByb3VuZCwgY2hvaWNlLCBpc19ib3QpDQoNCg0KIyBpZGVudGlmeSByb3VuZCBvZiBkcm9wb3V0Og0KZmlyc3RfZHJvcG91dCA8LSBkcm9wb3V0X2xvbmcgJT4lDQogIGZpbHRlcihpc19kcm9wb3V0ID09IDEpICU+JQ0KICBncm91cF9ieShwYXJ0aWNpcGFudC5sYWJlbCkgJT4lDQogIHN1bW1hcmlzZShkcm9wb3V0X3JvdW5kID0gbWluKHJvdW5kKSwNCiAgICAgICAgICAgIC5ncm91cHMgPSAiZHJvcCIpDQoNCiMgYW5kIGFkZCB0byB0aGUgZGY6DQpkZl9sb25nIDwtIGRmX2xvbmcgJT4lDQogIGxlZnRfam9pbihmaXJzdF9kcm9wb3V0LCBieSA9ICJwYXJ0aWNpcGFudC5sYWJlbCIpDQoNCiMgYWdncmVnYXRlZA0KZGZfcGxvdCA8LSBkZl9sb25nICU+JQ0KICBncm91cF9ieShyb3VuZCkgJT4lDQogIHN1bW1hcmlzZSgNCiAgICBwY3RfY2hvaWNlMSA9IG1lYW4oY2hvaWNlLCBuYS5ybSA9IFRSVUUpICogMTAwLCAgIyBwcm9wb3J0aW9uICogMTAwDQogICAgbiA9IG4oKQ0KICApDQoNCmdncGxvdChkZl9wbG90LCBhZXMoeCA9IHJvdW5kLCB5ID0gcGN0X2Nob2ljZTEpKSArDQogIGdlb21fbGluZShncm91cCA9IDEsIGNvbG9yID0gInN0ZWVsYmx1ZSIsIHNpemUgPSAuNSkgKw0KICBnZW9tX3BvaW50KGNvbG9yID0gInN0ZWVsYmx1ZSIsIHNpemUgPSAyKSArDQogICBnZW9tX2hsaW5lKHlpbnRlcmNlcHQgPSAxMCwgbGluZXR5cGUgPSAibG9uZ2Rhc2giLCBjb2xvciA9ICJkYXJrZ3JleSIsIHNpemUgPSAwLjgpICsgICMgZGFzaGVkIGxpbmUgYXQgMTANCiAgc2NhbGVfeF9jb250aW51b3VzKGJyZWFrcyA9IGRmX3Bsb3Qkcm91bmQpICsNCiAgc2NhbGVfeV9jb250aW51b3VzKGxpbWl0cyA9IGMoMCwgMTAwKSkgKyAgDQogIGxhYnMoDQogICAgeCA9ICJSb3VuZCIsDQogICAgeSA9ICIlIGFnZW50cyBjaG9vc2luZyAnYmx1ZSciLA0KICAgIHRpdGxlID0gIkV2b2x1dGlvbiBvZiBhbiB1bnBvcHVsYXIgbm9ybSINCiAgKQ0KDQojc29ydCBieSBub2RlDQpkZl9sb25nIDwtIGRmX2xvbmcgJT4lDQogIGFycmFuZ2UocGFydGljaXBhbnQubm9kZSkgJT4lDQogIHNlbGVjdCgtcGFydGljaXBhbnQubGFiZWwpDQoNCmRmX2xvbmckZHJvcG91dF9yb3VuZFtpcy5uYShkZl9sb25nJGRyb3BvdXRfcm91bmQpXSA8LSAyNSAjbm9uIGRyb3BvdXRzLCBzZXQgdG8gMjUuDQpgYGANCg0KYGBge3IsY2xhc3Muc291cmNlID0gJ2ZvbGQtaGlkZSd9DQojIG1ha2Ugcm9sZXMgY29uc2lzdGVudCB3aXRoIHV0aWxpdHkgZnVuY3Rpb24gcm9sZXMNCmRmX2xvbmckcm9sZSA8LSBpZmVsc2UoZGZfbG9uZyRwYXJ0aWNpcGFudC5yb2xlID09ICJCbHVlIiwgInRyZW5kc2V0dGVyIiwgImNvbmZvcm1pc3QiKQ0KDQojIHNwZWNpZmljeSBpbmNlbnRpdmUgc3RydWN0dXJlIHBhcmFtZXRlcnMNCnBhcmFtcyA9IGxpc3QocyA9IDE1LCBlID0gMTAsIHcgPSA0MCwgeiA9IDUwLCBsYW1iZGExID0gNSwgbGFtYmRhMiA9IDEuOCkNCg0KZGZfbG9uZyRpZCA8LSBkZl9sb25nJHBhcnRpY2lwYW50Lm5vZGUgKyAxICNub2RlcyBhcmUgMC1pbmRleGVkDQoNCiNhZGQgZGVncmVlDQpkZWcgPC0gZGVncmVlKGcpDQpkZl9sb25nIDwtIGRmX2xvbmcgJT4lDQogIG11dGF0ZShkZWdyZWUgPSBkZWdbaWRdKQ0KDQpjYWxjdWxhdGVfcm91bmRfdXRpbGl0aWVzIDwtIGZ1bmN0aW9uKGN1cnJlbnRfcm91bmQsIGRmX2xvbmcsIG5ldHdvcmssIHBhcmFtcykgew0KICAjIHByZXZpb3VzIHJvdW5kIGRhdGENCiAgZGZfcHJldiA8LSBkZl9sb25nICU+JQ0KICAgIGZpbHRlcihyb3VuZCA9PSBjdXJyZW50X3JvdW5kIC0gMSkgJT4lDQogICAgc2VsZWN0KGlkLCByb2xlLCBjaG9pY2UpDQogIA0KICAjIGN1cnJlbnQgcm91bmQgZGF0YQ0KICBkZl9jdXJyIDwtIGRmX2xvbmcgJT4lDQogICAgZmlsdGVyKHJvdW5kID09IGN1cnJlbnRfcm91bmQpDQogIA0KICAjIGNvbXB1dGUgdXRpbGl0aWVzDQogIGRmX2N1cnIgPC0gZGZfY3VyciAlPiUNCiAgICByb3d3aXNlKCkgJT4lDQogICAgbXV0YXRlKA0KICAgICAgdXRpbF8wID0gZnV0aWxpdHkoYWdlbnRfaWQgPSBpZCwgY2hvaWNlID0gMCwNCiAgICAgICAgICAgICAgICAgICAgICAgICBhZ2VudHMgPSBkZl9wcmV2LA0KICAgICAgICAgICAgICAgICAgICAgICAgIG5ldHdvcmsgPSBuZXR3b3JrLA0KICAgICAgICAgICAgICAgICAgICAgICAgIHBhcmFtcyA9IHBhcmFtcykkdXRpbGl0eSwNCiAgICAgIHV0aWxfMSA9IGZ1dGlsaXR5KGFnZW50X2lkID0gaWQsIGNob2ljZSA9IDEsDQogICAgICAgICAgICAgICAgICAgICAgICAgYWdlbnRzID0gZGZfcHJldiwNCiAgICAgICAgICAgICAgICAgICAgICAgICBuZXR3b3JrID0gbmV0d29yaywNCiAgICAgICAgICAgICAgICAgICAgICAgICBwYXJhbXMgPSBwYXJhbXMpJHV0aWxpdHkNCiAgICApICU+JQ0KICAgIHVuZ3JvdXAoKQ0KICANCiAgcmV0dXJuKGRmX2N1cnIpDQp9DQoNCiMjY2FsY3VsYXRlX3JvdW5kX3V0aWxpdGllcygyLCBkZl9sb25nLCBuZXR3b3JrID0gZywgcGFyYW1zID0gcGFyYW1zKQ0KDQojY29tcHV0ZSB1dGlsaXRpZXMgZm9yIGFsbCByb3Vuc2QgKGV4Y2VwdCByb3VuZCAxKQ0KbWF4X3JvdW5kIDwtIG1heChkZl9sb25nJHJvdW5kKQ0KZGYgPC0gbWFwX2RmcigyOm1heF9yb3VuZCwgfmNhbGN1bGF0ZV9yb3VuZF91dGlsaXRpZXMoLngsIGRmX2xvbmcsIGcsIHBhcmFtcykpDQoNCiMgaWRlbnRpZnkgYmVzdCByZXBsaWVzDQpkZiA8LSBkZiAlPiUNCiAgbXV0YXRlKA0KICAgIHByZWRpY3RlZF9jaG9pY2UgPSBpZmVsc2UodXRpbF8xID4gdXRpbF8wLCAxLCAwKSwNCiAgICBiZXN0X3JlcGx5ID0gKGNob2ljZSA9PSBwcmVkaWN0ZWRfY2hvaWNlKSAgIyBUUlVFIGlmIGFnZW50IHBpY2tlZCB0aGUgY2hvaWNlIHdpdGggaGlnaGVzdCB1dGlsaXR5DQogICkNCg0KDQpkZl9zdW1tYXJ5IDwtIGRmICU+JQ0KICBtdXRhdGUoDQogICAgcHJlZmVycmVkX2Nob2ljZSA9IGlmZWxzZShyb2xlID09ICJ0cmVuZHNldHRlciIsIDEsIDApLCAgICAjIGRlZmluZSBwcmVmZXJyZWQgb3B0aW9uIGJ5IHJvbGUNCiAgICBjaG9zZV9wcmVmZXJyZWQgPSAoY2hvaWNlID09IHByZWZlcnJlZF9jaG9pY2UpICAgICAgICAgICAgIyBUUlVFIGlmIHRoZXkgcGlja2VkIHRoZWlyIHByZWZlcnJlZCBvcHRpb24NCiAgKSAlPiUNCiAgZ3JvdXBfYnkocm91bmQsIHJvbGUpICU+JQ0KICBzdW1tYXJpemUoDQogICAgbl9hZ2VudHMgPSBuKCksDQogICAgcHJvcF9wcmVmZXJyZWQgPSBtZWFuKGNob3NlX3ByZWZlcnJlZCksICAgIyBmcmFjdGlvbiB0aGF0IGNob3NlIHRoZWlyIHByZWZlcnJlZCBvcHRpb24NCiAgICBwcm9wX2Jlc3RfcmVwbHkgPSBtZWFuKGJlc3RfcmVwbHkpLCAgICAgICAjIGZyYWN0aW9uIHRoYXQgcGlja2VkIHRoZSBoaWdoZXN0LXV0aWxpdHkgY2hvaWNlDQogICAgLmdyb3VwcyA9ICJkcm9wIg0KICApDQoNCg0KZ2dwbG90KGRmX3N1bW1hcnksIGFlcyh4ID0gcm91bmQpKSArDQogIGdlb21fbGluZShhZXMoeSA9IHByb3BfcHJlZmVycmVkLCBjb2xvciA9ICJQcmVmZXJlbmNlIiksIHNpemUgPSAxKSArDQogIGdlb21fbGluZShhZXMoeSA9IHByb3BfYmVzdF9yZXBseSwgY29sb3IgPSAiQmVzdCByZXBseSIpLCBzaXplID0gMSwgbGluZXR5cGUgPSAiZGFzaGVkIikgKw0KICBmYWNldF93cmFwKH5yb2xlKSArDQogIHNjYWxlX3lfY29udGludW91cyhsYWJlbHMgPSBzY2FsZXM6OnBlcmNlbnRfZm9ybWF0KGFjY3VyYWN5ID0gMSksIGxpbWl0cyA9IGMoMCwxKSkgKw0KICBzY2FsZV9jb2xvcl9tYW51YWwodmFsdWVzID0gYygiUHJlZmVyZW5jZSIgPSAiZGFya2dyZWVuIiwgIkJlc3QgcmVwbHkiID0gInN0ZWVsYmx1ZSIpKSArDQogIGxhYnMoDQogICAgeCA9ICJSb3VuZCIsDQogICAgeSA9ICJQcm9wb3J0aW9uIG9mIGFnZW50cyIsDQogICAgY29sb3IgPSAiTWV0cmljIiwNCiAgICB0aXRsZSA9ICJGb2xsb3dpbmcgcHJlZmVyZW5jZSB2cyBiZXN0LXJlcGx5IG92ZXIgcm91bmRzIg0KICApDQoNCmBgYCANCg0KDQpgYGB7cn0NCnRhYmxlKGRhdGEkc3VydmV5LjEucGxheWVyLmVuam95bWVudCkNCnRhYmxlKGRhdGEkc3VydmV5LjEucGxheWVyLmNsYXJpdHkpDQp0YWJsZShkYXRhJHN1cnZleS4xLnBsYXllci5tYWpvcml0eSkNCmZzaG93ZGYodW5pcXVlKGRhdGEkc3VydmV5LjEucGxheWVyLnN0cmF0ZWd5KSkNCmZzaG93ZGYodW5pcXVlKGRhdGEkc3VydmV5LjEucGxheWVyLnBlcmNlaXZlZF9ycSkpDQpmc2hvd2RmKHVuaXF1ZShkYXRhJHN1cnZleS4xLnBsYXllci5jb21tZW50cykpDQoNCiNjb21wbGV0aW9uX2NvZGU6Q0k1QkZMQUINCg0KYGBgDQo=
Copyright © Rob Franken